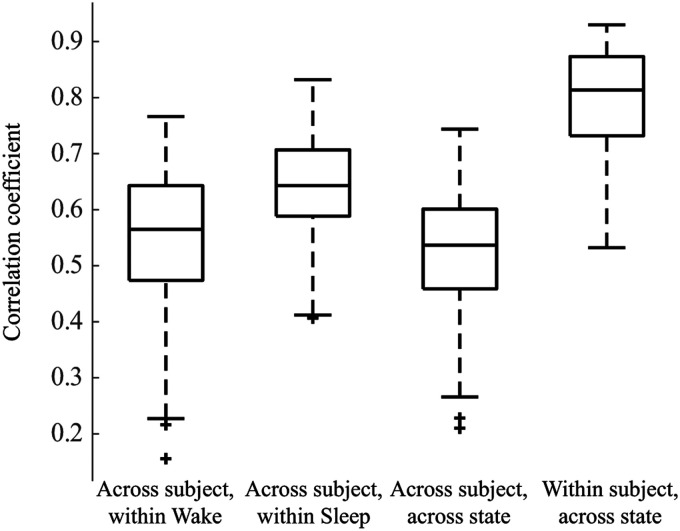
Figure 2. .
Box plot showing 2-D correlations within and across weighted connectivity matrices for each subject. We first compared networks across subjects within a state, for example, Subject 1 Wake to Subject 2 Wake, and the analogous comparisons during sleep; n = 171 observations each. Then we compared across subjects and across states, for example, Subject 1 Wake to Subject 2 Sleep; n = 171 observations. Lastly, we calculated the 2-D correlation between the sleep and wake networks within single subjects, for example, Subject 1 Wake to Subject 1 Sleep; n = 19 observations. All distributions are statistically significantly different from one another (Wilcoxon rank-sum test, p < 0.05).

