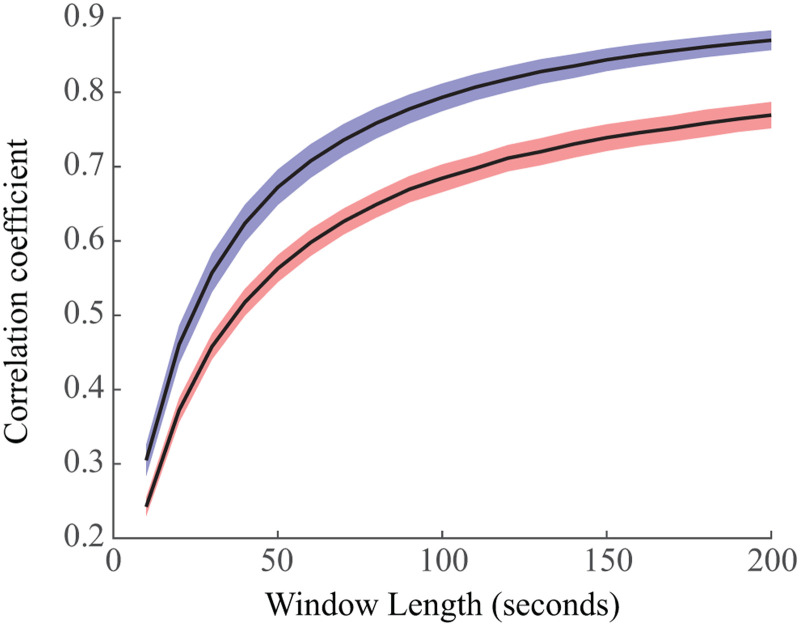
Figure 4. .
Stability of functional connectivity networks in wakefulness (red) and sleep (blue). We calculated the 2-D correlation between independent averaged connectivity networks from windows of data of varying size. We found that sleep exhibited more stable networks, with nonoverlapping confidence intervals for the means for all window sizes.

