Figure 5. .
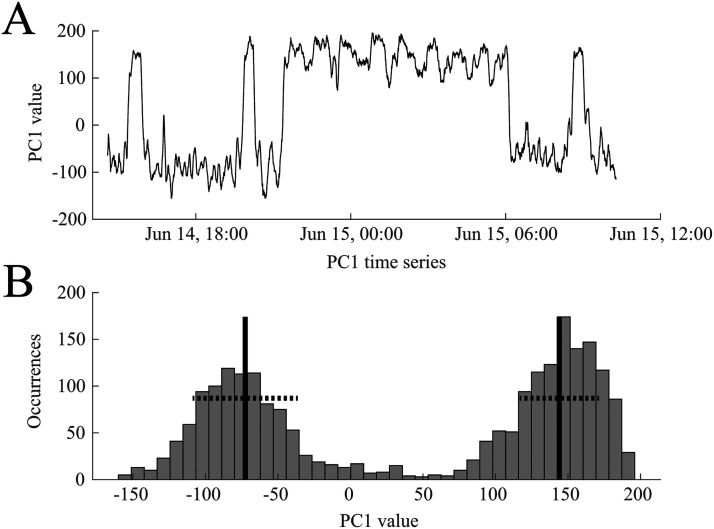
A representative example of the time course of the first principal component (PC1), reflecting how much weight is assigned to PC1 in the functional connectivity time series. (A) PC1 oscillates between two states during ∼18 hr of EEG data. (B) The bimodal nature of PC1 is reflected in its histogram. A two-component Gaussian mixture model was derived from these values and used to classify the two states. The black vertical lines indicate the means of the two distributions, and the dashed horizontal lines denote one standard deviation. Data are from Subject 1.

