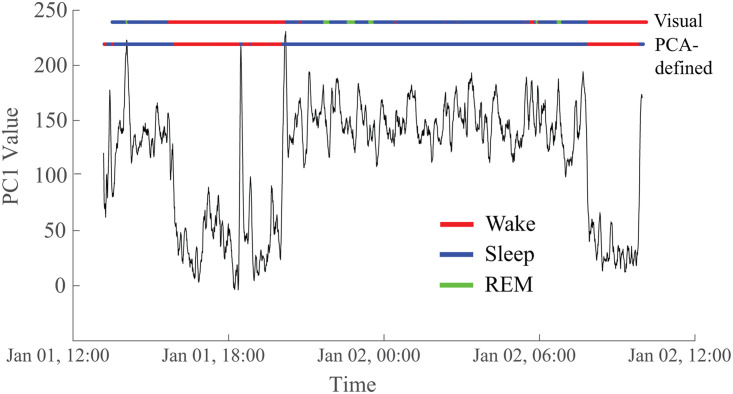
Figure 6. .
The two states derived from the PC1 time series correspond to visually marked sleep and wakefulness in the EEG. In this representative example, the correspondence is 95.1%. The top horizontal line (“Visual”) is colored to indicate the sleep/wake state based on visual markings. Red indicates the subject is awake, blue is non-REM sleep, and green is REM sleep. The bottom horizontal line (“PCA-defined”) reflects the values of the first principal component after thresholding based on the Gaussian mixture model, with red representing wakefulness and blue representing sleep. Data are from Subject 5.

