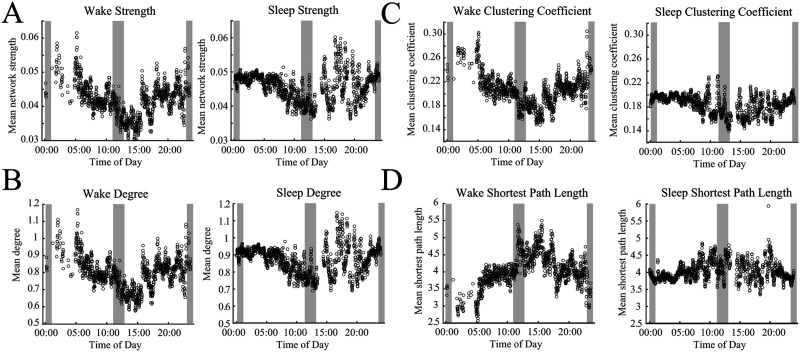
Figure 7. .
Circadian patterns emerge in both wakefulness and sleep for network strength and graph theoretical metrics. Twenty-four hour periodicities are shown for (A) the network strength, defined as the mean of all connections, (B) network degree, (C) clustering coefficient, and (D) the shortest path length. Each subfigure shows data recorded during wakefulness (left) and sleep (right). Gray shaded regions mark daytime (11:00–13:00) and nighttime (23:00–01:00) hours.

