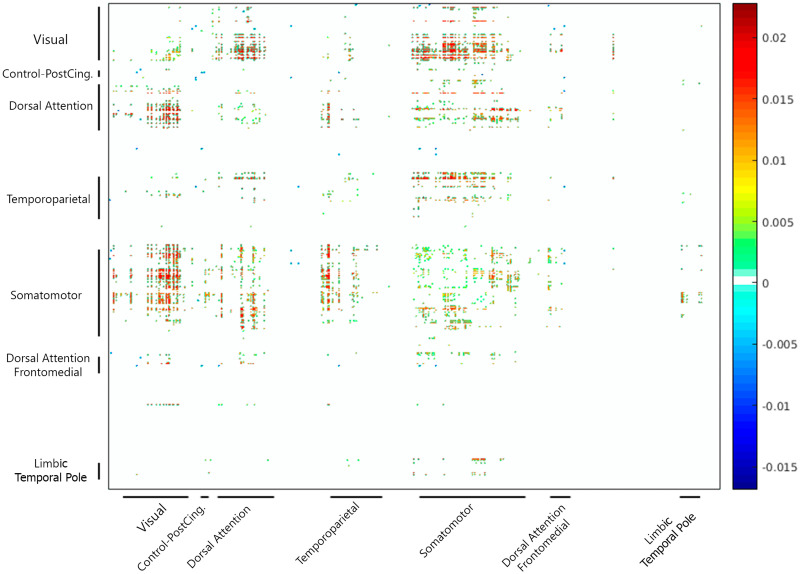
Figure 7. .
Impact of EO-EPI removal on pairwise connectivity. For each participant, 500-region connectivity matrices were produced from time series from which the variance attributable to EO-EPI was either removed (‘clean’) or not (‘raw’). Pairwise connectivity differences were then computed at group level to identify region pairs where EO-EPI removal produced a change in connectivity strength. Family-wise control: Raw − Clean, p < .05 two tailed, for each single connection, corrected for multiple comparisons using FDR.

