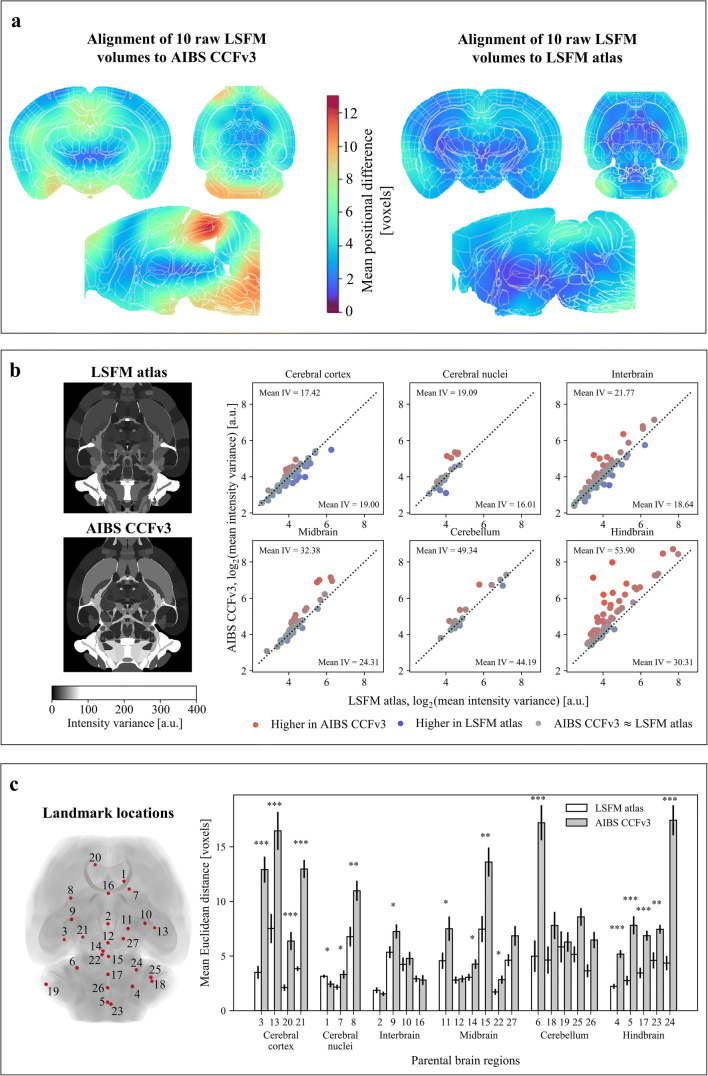
Fig. 3.
Improved registration of LSFM-acquired brain volumes using the LSFM atlas. a) Heatmaps illustrate the average magnitude of the deformation resulting from the registration of ten random raw LSFM brain volumes to the AIBS CCFv3 and to the LSFM atlas. b) Registration using the LSFM mouse brain atlas enables improved alignment between individual brains. Intensity variance, a measure for registration performance, was calculated per brain region for the ten random brain volumes aligned to the LSFM atlas and for the same ten brain volumes aligned to the AIBS CCFv3. Highest intensity variance was detected in both cases in ventricular and hindbrain regions (example sections, left). Statistical analysis of the intensity variance was performed using two-tailed Welch’s t-test and the resulting significant regions are visualized in the scatter plot (right) along with the mean intensity variance per major brain region for both atlases (denoted as mean IV). The results indicate that the difference in intensity variance values was small for cortical areas. However, majority of brain regions in cerebral nuclei, interbrain, midbrain, cerebellum and hindbrain exhibited higher intensity variance when the AIBS CCFv3 was used for registration compared to when the LSFM atlas was used for registration. c) Registration of the ten brain volumes was further evaluated using 27 landmarks distributed over the whole brain (overview of the landmark positions, left). The landmarks were divided between the six major brain areas in both atlases as well as in the ten brain volumes. Distances between the corresponding landmarks in the individual brains and the atlas templates were calculated after registering the ten brain volumes to the LSFM atlas and the AIBS CCFv3 (bar plot, right). For most landmarks, the calculated distances are lower when the LSFM atlas is used as template. Significant differences in distances between the two atlases was consistently observed in cerebral cortex and hindbrain. Two-tailed Welch’s t-test was applied for determining statistical significance in landmark distances between the atlases: ∗ for 0.01 ≤ p < 0.05, ∗∗ for 0.001 ≤ p < 0.01 and ∗∗∗ for p < 0.001

