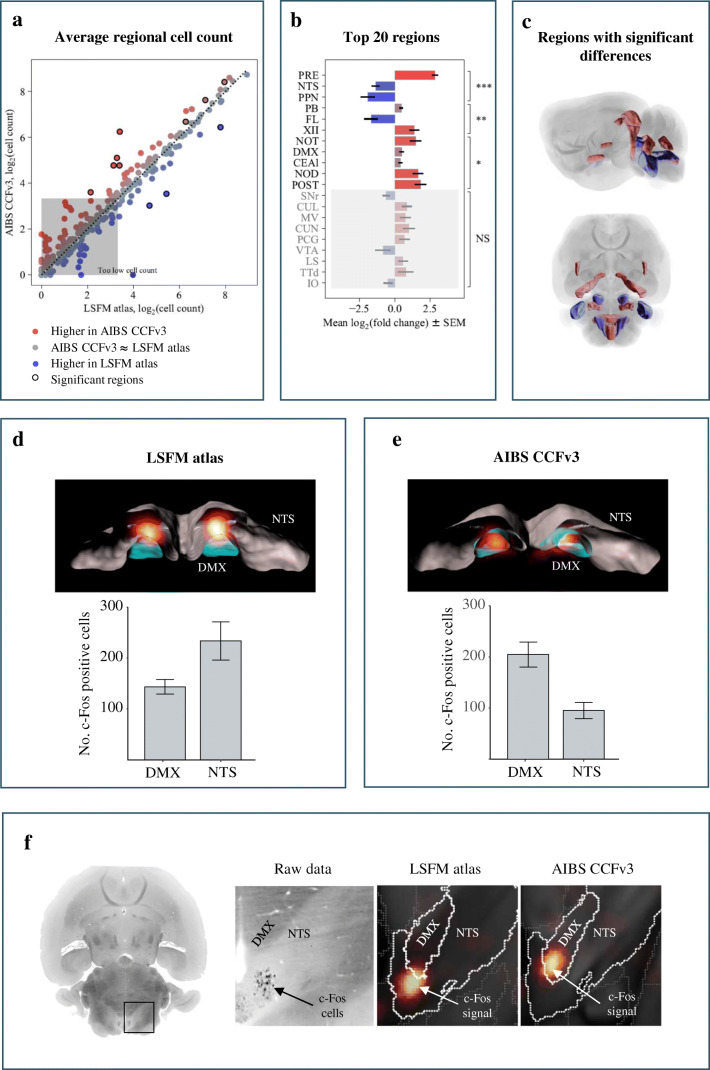
Fig. 4.
Choice of brain atlas influences the number of c-Fos positive cells per brain region. Comparison of number of c-Fos positive cells in response to semaglutide treatment using the LSFM atlas and the AIBS CCFv3. a) Average number of detected c-Fos expressing cells in every brain region after registration to either the AIBS CCFv3 or the LSFM atlas. Regions in which the c-Fos positive cells are differentially quantified are highlighted by a circle surrounding the data points. An average cell count per group below ten is considered too low to judge. b) The bar chart lists the brain regions and the corresponding mean log2 fold changes of quantified c-Fos positive cells in these regions according to the p value. Blue = higher with LSFM atlas, red = higher with CCFv3. NS stands for not significant, ∗ for 0.01 ≤ p < 0.05, ∗∗ for 0.001 ≤ p < 0.01 and ∗∗∗ for p < 0.001. c) Horizontally and sagittally depicted brain volumes highlight the regions in which the c-Fos cells were differentially quantified while using the LSFM atlas and the AIBS CCFv3 for the analysis (same colour code as in b and c). See Online Resource 2 for full names of the brain regions. d-e) Comparison of total number of c-Fos positive cells quantified in 3D-volumes of the nucleus of the solitary tract (NTS) and the dorsal motor nucleus of the vagus nerve (DMX) using the LSFM atlas and the AIBS CCFv3. DMX (blue) and NTS (grey) volumes of both atlases in which the signal (glow colormap) was quantified is visualized in 3D renderings. d) Quantification of c-Fos positive cells following registration of the LSFM atlas to the LSFM-acquired brain volumes showed that in average 234 ± 38 c-Fos positive cells were found in the NTS and 144 ± 14 in the DMX. e) Quantification of c-Fos positive cells following registration of the AIBS CCFv3 to the LSFM-acquired brain volumes. Here the majority of the signal is found in the DMX. Quantification revealed that on average 95 ± 16 c-Fos positive cells are counted in the NTS and 205 ± 25 in the DMX. f) Comparing the raw data to the data in alignment with atlases. DMX has a dense dark appearance compared to NTS

