Fig. 5.
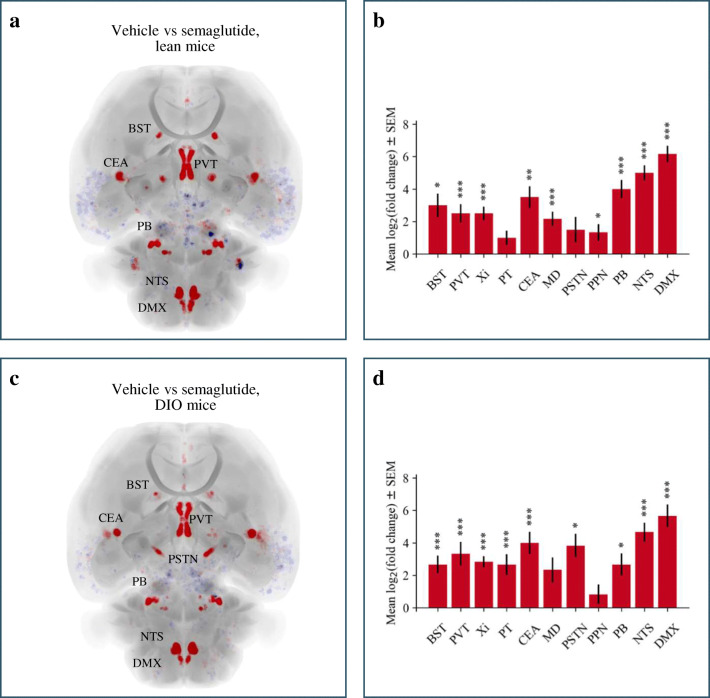
Differentially regulated c-Fos expression in response to semaglutide administration. Up (red) and down (blue) regulation of c-Fos expression in a) semaglutide treated lean mice in comparison to vehicle treated lean mice and c) in semaglutide treated DIO mice in comparison to vehicle treated DIO mice. Differentially regulated brain regions in response to semaglutide administration in comparison to vehicle treatment and corresponding mean log2 fold changes of c-Fos positive cells in these regions in b) lean and d) DIO mice. ∗ stands for 0.01 ≤ p < 0.05, ∗ ∗ for 0.001 ≤ p < 0.01 and ∗ ∗ ∗ for p < 0.001. P-values were adjusted for multiple comparisons using the false discovery rate. See Online Resource 2 for full names of the brain regions

