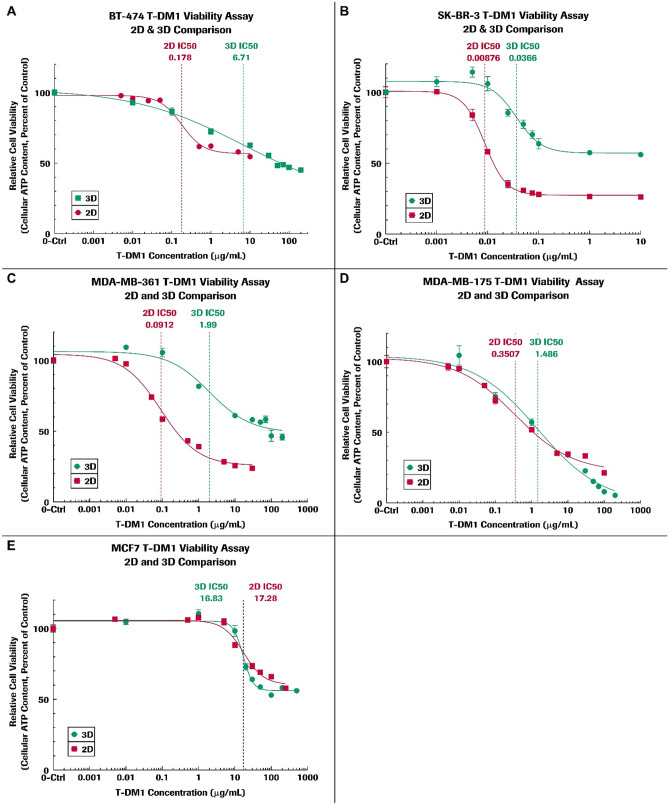
Fig. 2.
Viability assay results are shown as plots of relative cell viability versus T-DM1 concentration for BT-474, SK-BR-3, MDA-MB-361, MDA-MB-175, and MCF-7 cell lines using 2D and 3D culture methods as described in the text. The 2D cell viability results are in red and 3D results in green. GraphPad Prism software was used for statistical analysis and calculation of the best-fit curves and for plotting data. The data points on each plot are generated from six replicates and are represented on the plot as mean ± standard error of the mean. The estimated T-DM1 IC50 value based on the best-fit curves are labeled and shown as vertical dashed lines

