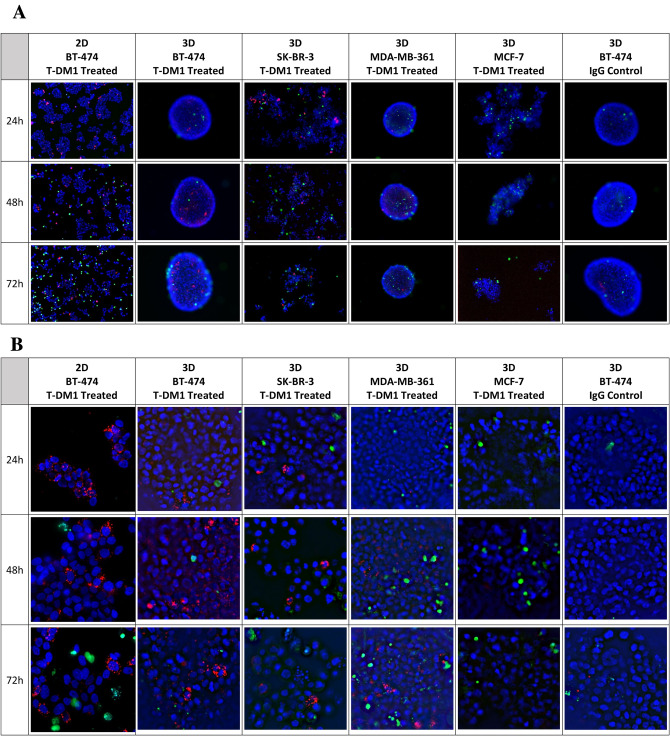
Fig. 4.
This figure shows internalization of fluorescent pHrodo™-labeled T-DM1 (red color) for cells grown as 3D spheroids or aggregates. Images in A are at ×8 magnification. Images in B are at ×20 magnification. The ×20 images of B are derived from the same cells, spheroids, or aggregates as the ×8 images of A. Dead cells are green in color (produced by NucGreen) and total cell nuclei are blue in color (produced by NucBlue). Images are arranged in rows showing a time course of T-DM1 internalization for 24 h, 48 h, and 72 h. The columns are labeled to show the cell lines and culture method used in the imaging. The first column shows the 2D BT-474 treated with pHrodo-labeled T-DM1 as a positive control, while the last column shows 3D cultured BT-474 cells treated with pHrodo-labeled IgG in BT-474 cells as a negative control

