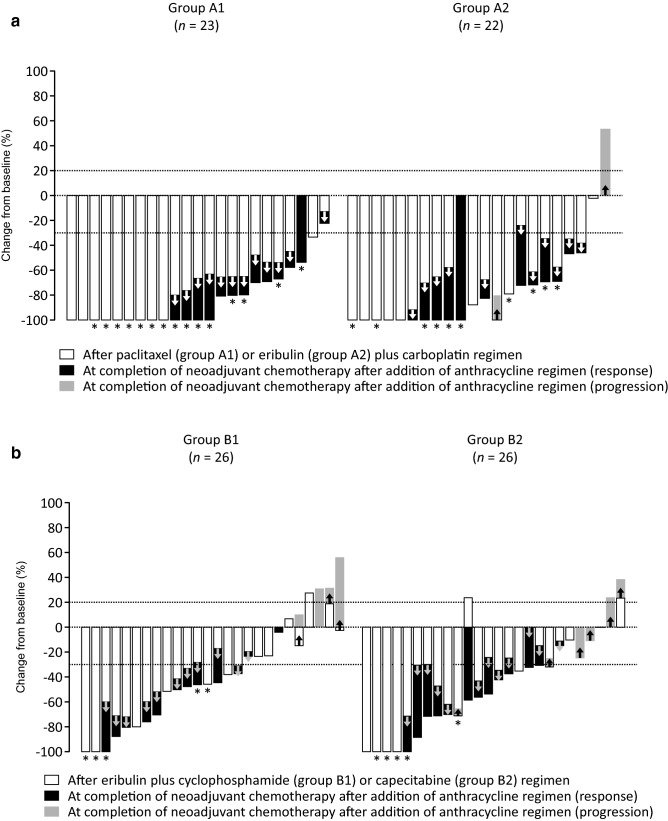
Fig. 3.
Waterfall plots showing change in tumor size from baseline a in group A1 (n = 23) and group A2 (n = 22) after the initial paclitaxel or eribulin plus carboplatin regimen and at completion of neoadjuvant chemotherapy, and b in group B1 (n = 26) and group B2 (n = 26) after the eribulin plus cyclophosphamide (group B1) or capecitabine (group B2) regimen and at completion of neoadjuvant chemotherapy. In group B, data of 2 patients (1 each in groups B1 and B2) who dropped out before cycle 4 are not shown. Asterisks (*) indicate patients with pathological complete response (CpCRypN0)

