Fig. 7.
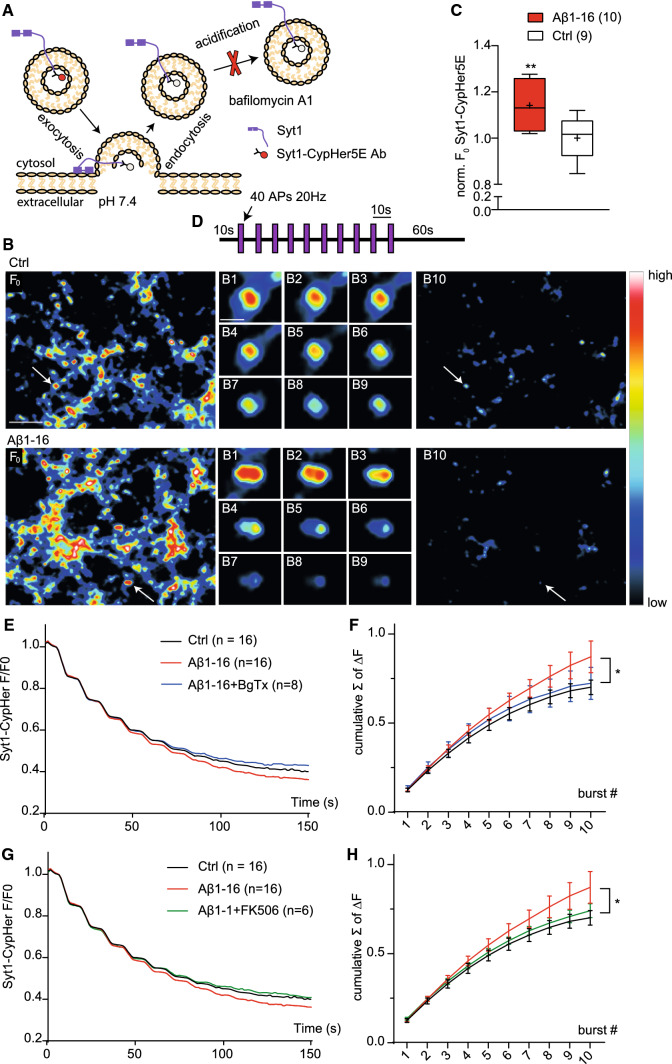
The N-terminal Aβ increases availability of SVs during repetitive stimulation dependently on α7nAChR and calcineurin activation. a Schematic representation of the Syt1-CypHer5E imaging. At rest, the fluorescence (F) of CypHer5E is completely unquenched in the low intra-vesicular pH (~ 5.5) and gets quenched upon SV exocytosis in the neutral extracellular media (~ 7.4). Following endocytosis and vesicular reacidification, the CypHer5E F increases again. Blockade of the v-ATPase with bafilomycin A1 prevents vesicular reacidification trapping SVs in the alkaline state. b Representative image F0 shows typical Syt1-CypHer5E loading in hippocampal neurons (17–20 DIV) incubated with either vehicle (Ctrl) or human Aβ1-16 (200 pM) for 1 h at 37 °C in Tyrode´s buffer with choline before Syt1-CypHer5E loading (1 h, 37 °C). c Quantification of the Syt1-CypHer5E loading (F0). Images B1–B9 show the course of destaining of an individual synapse (marked by arrow in the F0 overview image) upon application of stimulation protocol shown in d in the presence of bafilomycin A (1 μM). B10 shows the whole region upon application of the final stimulus. Scale bar is 5 μm in overview and 1 μm in close-up image. d Schematic representation of applied stimulation protocol. After 10 s of baseline, 10 bursts (B1–B10) of 40AP at 20 Hz spaced by 10 s pause were applied via electrical field stimulations. Imaging was continued for additional 60 s. e,g Traces showing average time-course of Syt1-CypHer5E F in response to the stimulation protocol in control and cells treated with Aβ1-16 alone or in presence of either BgTx (E) or FK506 (G). All values were normalized to F0. f, h Cumulative amplitude of Syt1-CypHer5E F calculated from curves shown in e and g. Data are obtained from at least four independent experiments and are expressed as a mean (e, g) or mean ± SEM (f, h) or as boxes depicting the interquartile range and median, with whiskers showing minimum and maximum values, and mean showed as + (c). Values in brackets show the number of analysed coverslips from four independent experiments. Unpaired t test was used to estimate statistical significance; *p < 0.05, **p < 0.01

