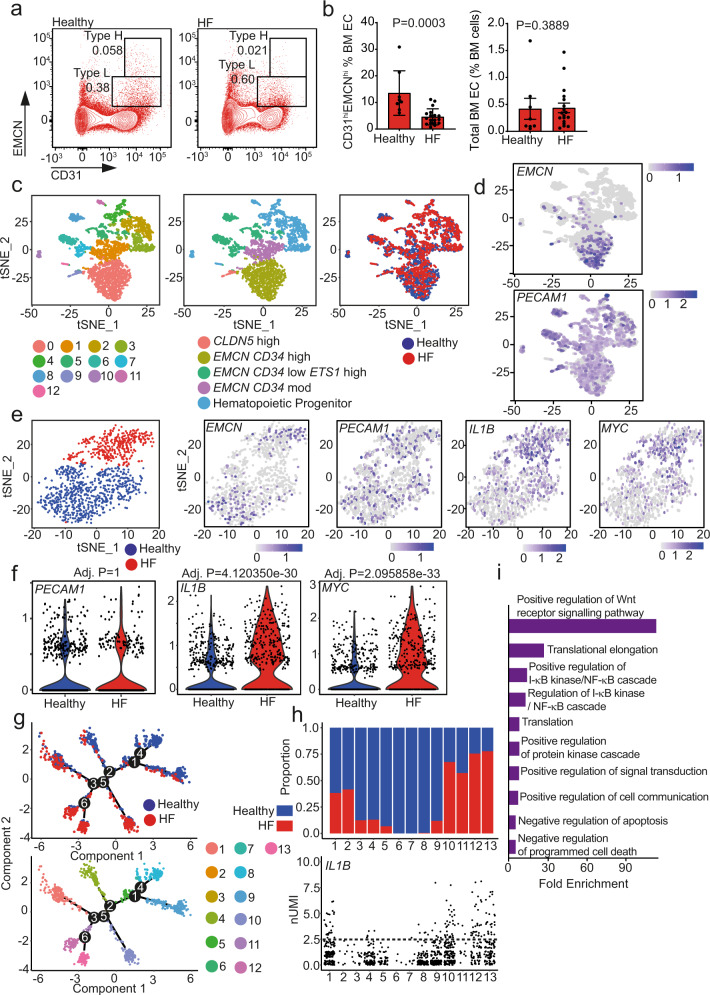
Fig. 2. IL1B is upregulated in EMCN-rich endothelial cells in post-myocardial infarction (MI) heart failure (HF).
a, b Flow cytometry analysis of healthy and HF patient bone marrow. a Gating strategy for endothelial cells. Representative flow cytometry dot plots showing endothelial cell subsets with a distinct expression of CD31 and Endomucin (EMCN) in healthy and HF bone marrow aspirates (gated on CD45negLinneg viable single cells). The numbers shown within the gates represent the percentages of events (cells) within that gates relative to the upstream parent gate (CD45negLinneg cells). b Type H endothelial cells are reduced in HF patients compared to healthy controls (left panel), while the total number of endothelial cells remains unchanged (right panel) (N = 8 for healthy, N = 18 for HF patients). BM EC, bone marrow endothelial cells. Data are shown as mean ± SEM. P-value was calculated by unpaired two-tailed, Mann–Whitney test. c–i scRNA-seq of a post-MI heart failure patient and age-matched healthy control. c, d Clustered cells from both subjects are displayed in t-SNE plots, colored by cluster (left), cell annotation (middle), and health status (right). d Expression of EMCN and PECAM1. EMCN is enriched in the cells corresponding to cluster 0. e–f Analysis of EMCN enriched cell cluster 0 population. e Health status-driven dichotomization in EMCN enriched population shown in t-SNE plot (Left). Relative expression of key genes in the EMCN-enriched population represented by features plots as indicated. f Violin plots showing the relative expression of key genes in the EMCN enriched population, confirming the significantly increased expression of IL1B and MYC in the HF sample. P-value was calculated by a two-tailed non-parametric Wilcoxon test with Bonferroni correction. g Distribution of cells along pseudotime trajectory branchpoint. Pseudotime analysis revealed 13 states. h Distribution of cells among pseudotime states and relative IL1B expression. Distribution analysis revealed that states 10, 11, 12, and 13 consist mainly of HF patient cells. IL1B expression is higher in states 12 and 13. The dashed line indicates normalized Unique Molecular Identifier (nUMI) counts of 2.5. i Gene ontology term ranking of upregulated genes in pseudotime state 13.

