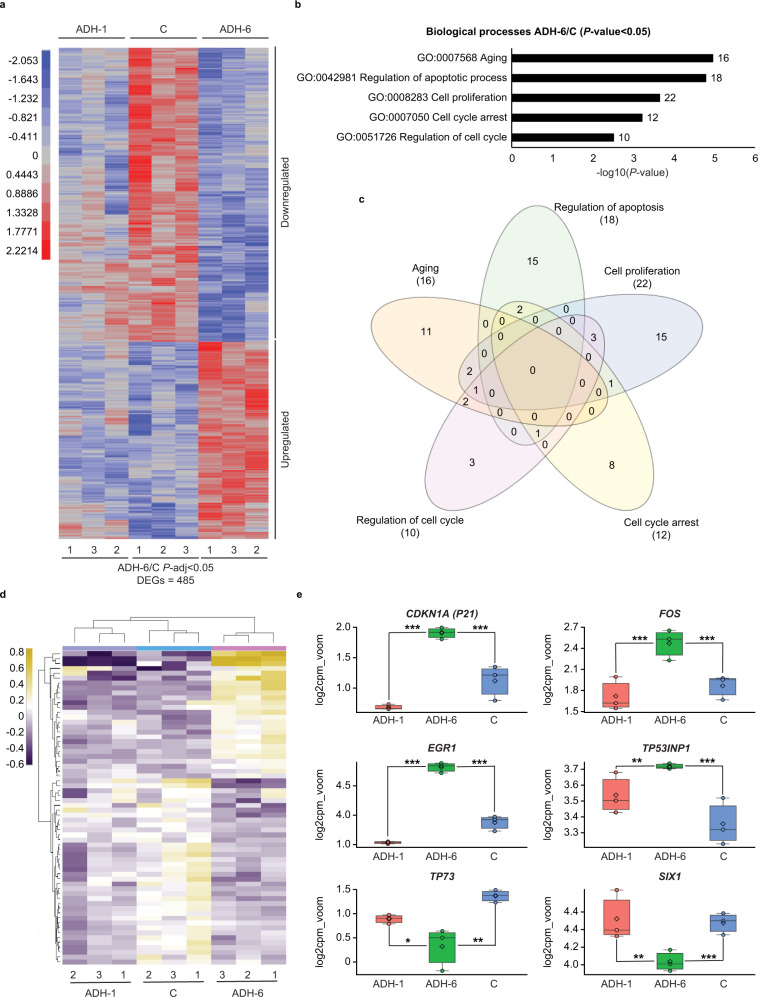
Fig. 5. Transcriptome analysis of oligopyridylamide-treated MIA PaCa-2 cells.
a Variance-stabilized count data heatmap showing clustering patterns of differentially expressed genes (DEGs) identified based on statistical significance of P-adj < 0.05 from the ADH-6 treatment group relative to vehicle-treated controls (C) (denoted ADH-6/C). Significance was assessed by false discovery rate (FDR) adjusted P-value (P-adj or q-value), which was obtained from the hypergeometric P-value that was corrected for multiple hypothesis testing using the Benjamin and Hochberg procedure122. The ADH-1 treatment group is included for comparison. The adjacent legend indicates the scale of expression, with red signifying upregulation, and blue downregulation, in ADH-6/C. b Gene ontology (GO) analysis of ADH-6/C showing the top five “biological process” term enrichments based on a cut-off of P-value <0.05 (normalized to −log10). Statistical analysis was performed using two-tailed unpaired t-test. c Venn diagram delineating overlap of DEGs between the processes in b. d Heatmap (scaled to log2 counts per million reads (log2cpm_voom)) displaying a finalized list of DEGs based on the Venn diagram. e Gene expression boxplots of DEGs selected from the heatmap in d (n = 3 biologically independent samples). The boxplots display the five-number summary of median (center line), lower and upper quartiles (box limits), and minimum and maximum values (whiskers). Statistical analysis was performed using two-tailed unpaired t-test. P < 0.0001 for Cdkn1a, FOS, EGR1, and SIX1, P = 0.0002 for Tp53inp1, and P = 0.0026 for TP73 (ADH-6/C); P < 0.0001 for Cdkn1a, FOS, and EGR1, P = 0.0072 for Tp53inp1, P = 0.0471 for TP73, and P = 0.0019 for SIX1 (ADH-6/ADH-1). *P < 0.05, **P < 0.01, ***P < 0.001 or non-significant (n.s., P > 0.05) for comparisons with vehicle-treated controls and between the different treatment groups.

