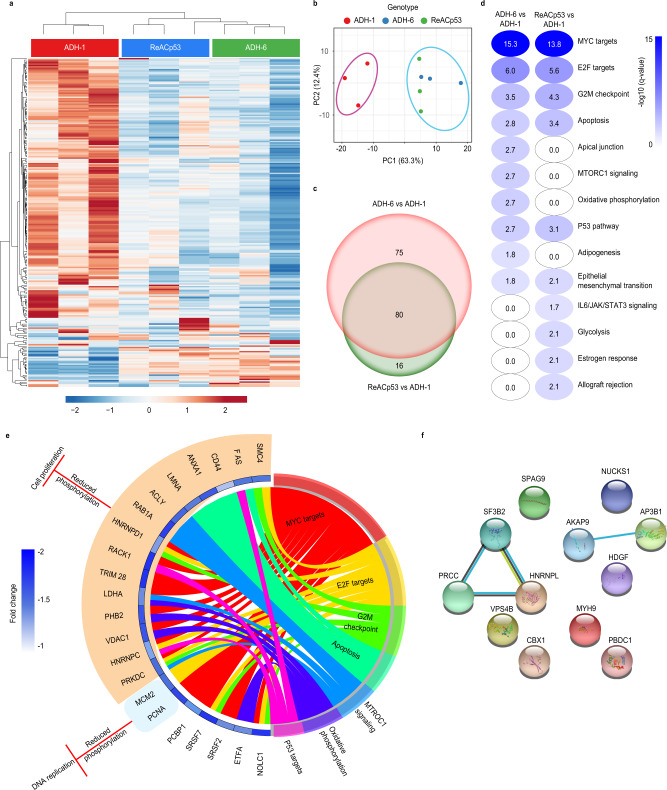
Fig. 6. Quantitative proteomic analysis of phosphoprotein expression in oligopyridylamide-treated MIA PaCa-2 cells.
a Heatmap showing differentially expressed phosphoproteins in ADH-1, ReACp53, and ADH-6 treated samples. Unsupervised hierarchical clustering reveals distinct segregation of ADH-1 vs ReACp53 and ADH-6. b Results from principal component analysis (PCA) showing that the main source of variation in the indicated groups was the compound/peptide treatment. c Venn diagram showing phosphoproteins that were differentially expressed in the ADH-6 vs ADH-1 and ReACp53 vs ADH-1 comparisons. The number of phosphoproteins that were unique or common in both comparisons are highlighted. d Gene set enrichment overlap analysis (GSEA) of hallmark signatures for the differentially expressed and downregulated phosphoproteins. Significance was assessed by q-value, or false discovery rate (FDR)-adjusted P-value, which was obtained from the hypergeometric P-value that was corrected for multiple hypothesis testing using the Benjamin and Hochberg procedure122. The hallmark signatures were ranked based on the −log10(q-value) of overlap. Only gene signatures that were significantly different (q-value <0.05 or −log10(q-value) >1.3) were further analyzed. e GOChord plot of phosphoproteins that belong to top dysregulated hallmark signatures (shown in d). The plot also depicts overlap of phosphoproteins between indicated gene signatures. Fold change of phosphoproteins (ADH-6 vs ADH-1) is represented by the blue track with the color spectrum depicting the level of reduction in phosphoprotein expression in the ADH-6 group. The biological roles of the downregulated phosphoproteins in ADH-6 were inferred from published data. The outer layer of the GOChord plot links the downregulation of phosphoproteins with the inhibition of DNA repair/replication and cell proliferation on the basis of previous reports (Supplementary Table 2a). f Protein–protein interaction (PPI) network map of upregulated phosphoproteins in ADH-6 vs ADH-1 treatments (biological roles of upregulated phosphoproteins are summarized in Supplementary Table 2b).

