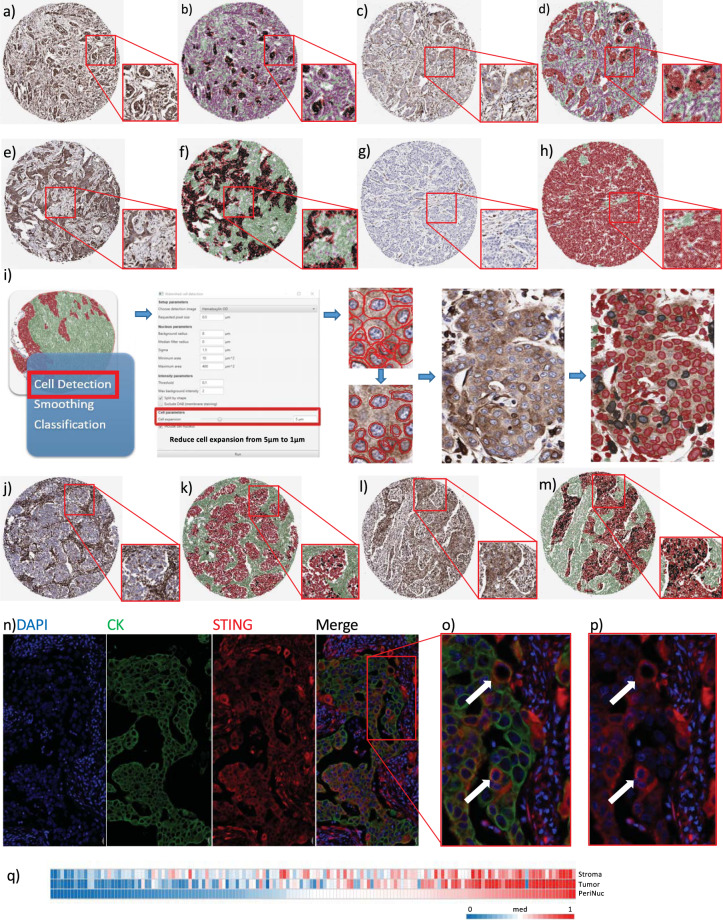
Fig. 1. STING immunohistochemistry in breast cancer.
Immunohistochemistry (IHC) images representing a high expression of STING in both tumor and stromal compartments without and b with QuPath mask, c low expression of STING in tumor with high expression in stroma without and d with QuPath mask, e high expression of STING in tumor with low expression in stroma without and f with QuPath mask and g low expression of STING in both tumor and stromal compartments without and h with QuPath mask. Magnification: cores × 4, inset × 8. i QuPath workflow for perinuclear STING analysis. Black = perinuclear STING positive cells, Red = perinuclear STING negative cells. IHC images representing j low but detectable perinuclear STING in an otherwise STING positive tumor without and k with QuPath mask and l high perinuclear STING expression without and m with QuPath mask. Magnification: cores x 4, inset x 8. n Multiplex IHC of tumor section with DAPI, STING (red) and cytokeratin (CK, green). Co-localization of STING and CK is demonstrated in o (with CK) and p (without CK), indicated by the white arrows. Magnification: n ×10, o, p ×20. q Correlation of stromal, tumor and perinuclear STING (absolute scores measured as percentage of positive cells) in breast cancer IHC cases. Stromal v. tumor: R = 0.7240, p < 0.0001, Stromal v. perinuclear: R = 0.6916, p < 0.0001, Tumor v. perinuclear: R = 0.8496, p < 0.0001.

