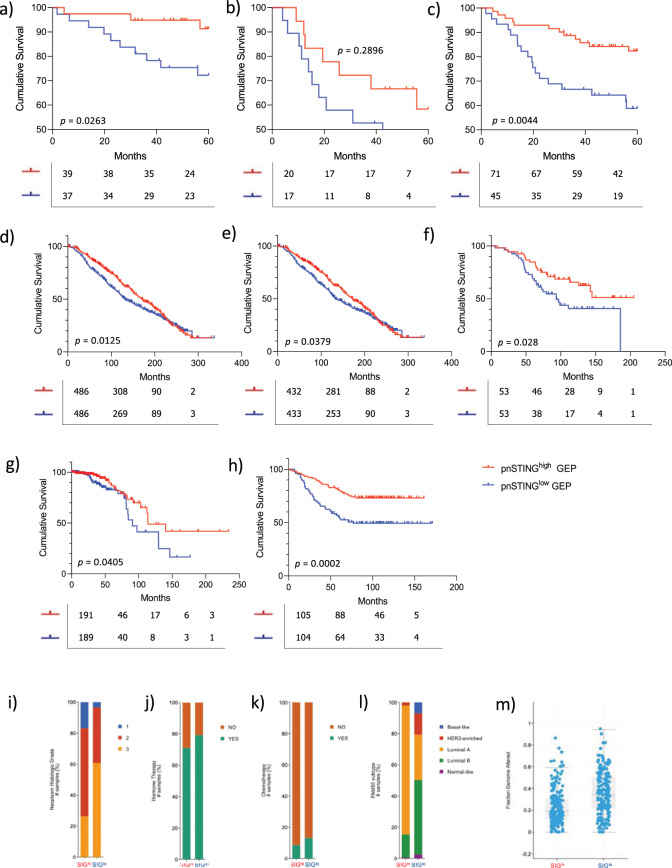
Fig. 5. pnSTINGlow gene expression signature is prognostic of poor outcome in independent datasets.
Kaplan Meier Curve analysis of relapse free survival (RFS; months) in a ER positive (ER + ), b ER negative (ER-) and c all samples with gene expression data only from discovery dataset stratified by pnSTING signature score threshold of the IHC cohort. Kaplan Meier Curve analysis of overall survival (months) in d ER + disease (all treatments) e those receiving hormone therapy only f those receiving chemotherapy in the METABRIC dataset stratified by pnSTING signature score. Kaplan Meier Curve analysis of overall survival (months) in ER+ disease from g TCGA 2012 dataset and h Wang dataset stratified by pnSTING signature score. Clinicopathological and molecular characteristics of METABRIC samples classified by pnSTING gene expression score comparing. i Tumor grade (adj. p < 0.0001). j Hormone therapy (adj. p = 0.009). k Chemotherapy (adj. p = 0.048). Clinicopathological and molecular characteristics of TCGA samples classified by pnSTING gene expression score comparing. l PAM50 subtype (adj. p < 0.0001) and m Fraction genome altered (adj. p < 0.0001).

