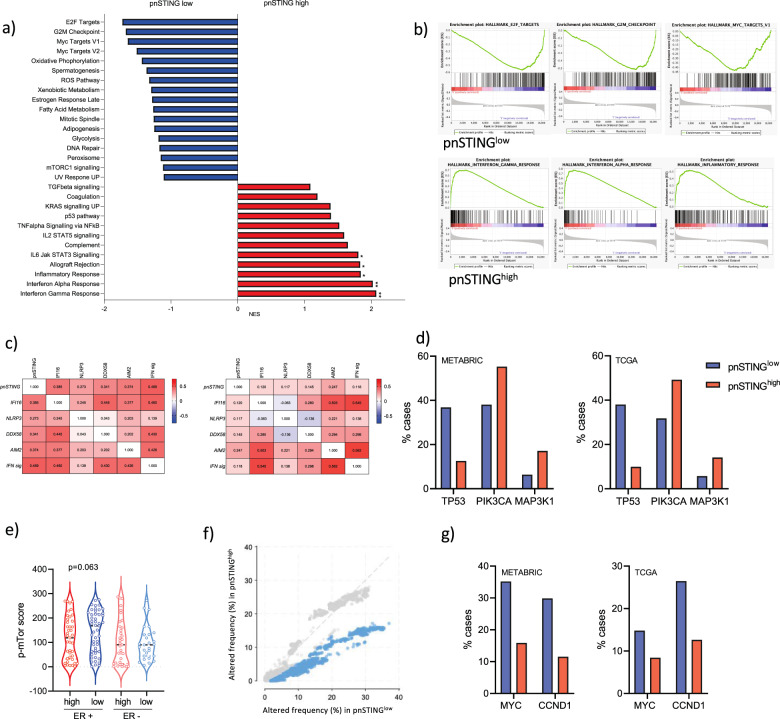
Fig. 6. Genomic and transcriptomic analysis of pnSTING signature classified ER + tumors.
a GSEA results showing Normalized Enrichment Scores (NES) for the gensets enriched >±1 in pnSTINGhigh signature (red) or pnSTINGlow signature (blue) samples. b Enrichment plots for the top 3 genesets enriched in pnSTINGhigh signature or pnSTINGlow signature samples. c Correlation matrices for (left) ER positive and (right) ER negative breast cancer for pnSTING value, gene expression of DNA and RNA sensors and 18-gene interferon signature. d Percentage of ER+ cases with mutations in TP53, PIK3CA and MAP3K1 in the METABRIC (left) and TCGA (right) 2012 datasets stratified based on high (above median) and low (below median) STING signature score. e Expression of p-mTOR (Ser2448) quantified using QuPath in the discovery dataset stratified based on ER expression and perinuclear STING expression (where red = pnSTINGhigh and blue = pnSTINGlow). Percentage of ER+ cases with copy number alteration f overall (with significance indicated in blue) in the METABRIC dataset and g of MYC and CCND1 in the METABRIC and TCGA 2012 datasets stratified based on high (above median) and low (below median) STING signature score.

