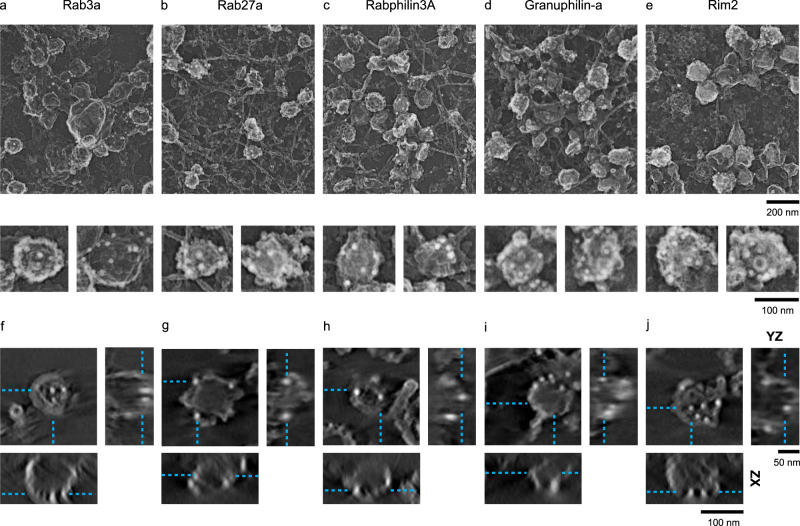
Fig. 4. Gold nanoprobe labeling of DCV proteins imaged with 2D and 3D PREM.
2D PREM images of PC12 cells transfected with His-tagged a Rab3a, b Rab27a, c Rabphilin3a, d Granuphilin-a, and e Rim2. The upper panel shows a representative crop from a larger PREM image of a cell (Supplementary Fig. 12) and the lower panel shows enlarged examples of individual DCV structures labeled with Ni-NTA-Au. Scale bars are 200 and 100 nm, respectively. Tomogram slice (XY view, scale bar = 100 nm) of an individual DCV structure labeled with Ni-NTA-Au for f Rab3a, g Rab27a, h Rabphilin3a, i Granuphilin-a, and j Rim2, and the XZ (scale bar = 100 nm) and YZ (scale bar = 50 nm) views for the z slice denoted by cyan dashed lines. Two independent imaging experiments were performed for 2D- and 3D-EM.

