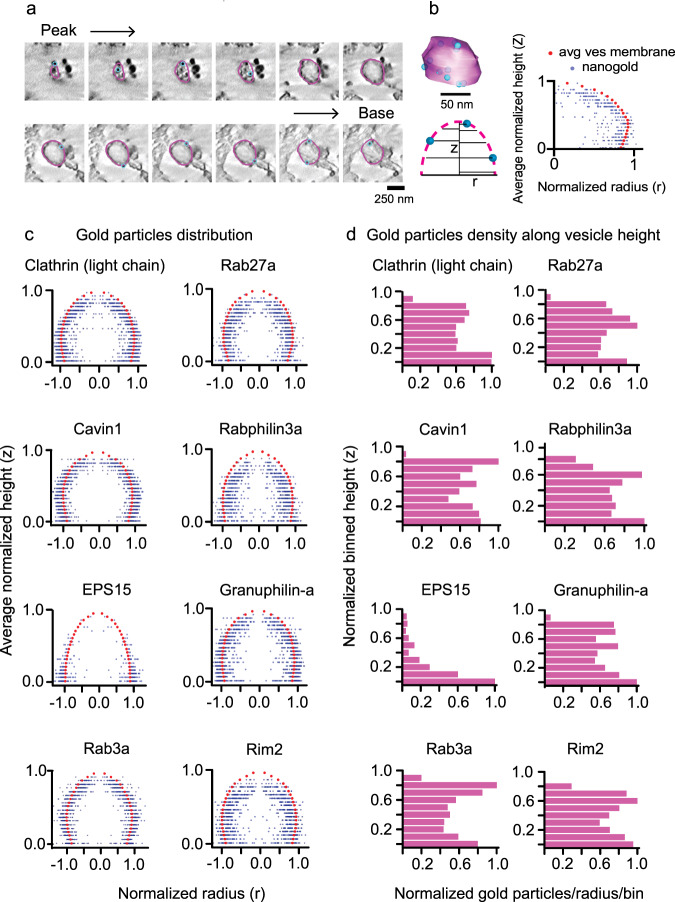
Fig. 5. 3D mapping of proteins on vesicles with nanogold.
a Tomogram z slices of a single clathrin-coated vesicle from peak to the base of the structure. b 3D model view of the vesicle from contour points for membrane (magenta) and scatter points for gold (blue) particles (upper panel, scale bar = 50 nm). Scheme (lower panel) for obtaining positions for gold particles with respect to vesicle membrane contours. Radius for each contour point (magenta, r), its height from the base of the vesicle (Z), radius for gold particle (blue), and its height. A representative profile on the right showing the distribution of gold particles (blue) with respect to the vesicle membrane (red). c Spatially averaged and normalized distribution profile for clathrin, cavin1, EPS15, Rab3a, Rab27a, Rabphilin3a, Granuphilin-a, and Rim2 on vesicles. The particles are reflected across the ordinate. d Density of gold-labeled proteins along the vesicle height (10 bins). The histograms show the sum of particles in each bin (for all vesicles) divided by the average radius of the bin per vesicle. The total number of vesicles collected and analyzed from two independent experiments (for a–d) are: clathrin light chain A, 54; Cavin1, 63; EPS15, 65; Rab3a, 59; Rab27a, 58; Rabphilin3a, 58; Granuphilin-a, 62; Rim2, 63 (Supplementary Table 2).

