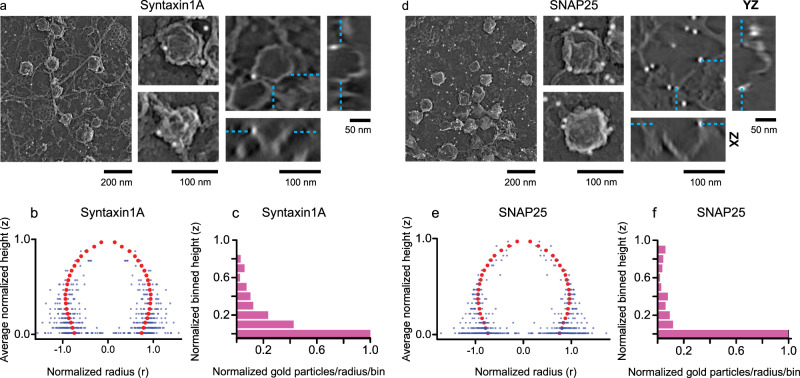
Fig. 6. 2D and 3D visualization of Syntaxin1A and SNAP25 on DCVs.
2D PREM images of PC12 cells transfected with His-tagged a Syntaxin1A and d SNAP25. The left panel (scale bar is 200 nm) shows a representative crop from a larger PREM image (Supplementary Fig. 12), the middle panel (scale bar = 100 nm) shows enlarged examples of individual DCV structures labeled with Ni-NTA-Au, and the right panel shows tomogram slice (XY view, scale bar = 100 nm) of an individual DCV structure labeled with Ni-NTA-Au and the XZ (scale bar = 100 nm) and YZ (scale bar = 50 nm) views for the z slice denoted by cyan dashed lines. b, e Spatially averaged and normalized distribution profiles for Syntaxin1A and SNAP25. The gold particles are reflected across the ordinate. c, f Density of gold-labeled proteins along the vesicle height (10 bins). The histograms show the sum of particles in each bin (for all vesicles) divided by the average radius of the bin per vesicle. The total number of vesicles collected and analyzed from two independent experiments (for a–f) are Syntaxin1A: 76, and SNAP25: 65 (Supplementary Table 2).

