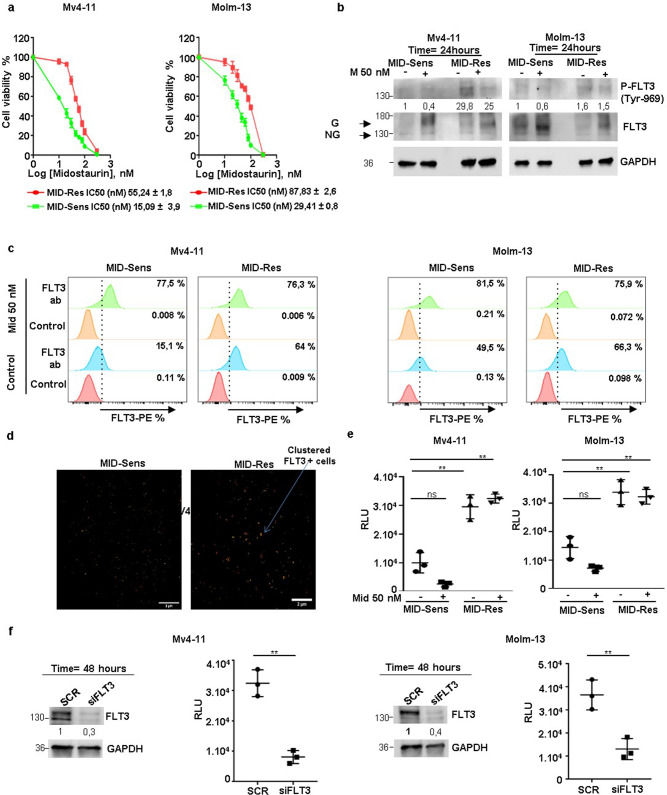
Fig. 1. FLT3 dependent RAC1 hyperactivation in MV4-11/MOLM-13 Midostaurin-resistant cells.
a Midostaurin (Mid) IC50/cell viability and FLT3 glycosylation/phosphorylation analysis in MV4-11/MOLM-13 Mid sensitive (MID-Sens) and resistant (MID-Res) cells. b FLT3 phosphorylation/glycosylation was analyzed in MV4-11/MOLM-13 MID-Sens ± MID and MID Res ± MID by Western blot. FLT3 blot, G means glycosylated band (160 kDa) and NG, non glycosylated band (130 kDa). c FLT3 surface expression was analyzed in MV4-11/MOLM-13 MID-Sens ± MID and MID Res ± MID by flow cytometry. d FLT3 receptor was analyzed in MV4-11 MID-Res versus MID-Sens by super-resolution microscopy dSTORM. e RAC1 activation was analyzed in MV4-11/MOLM-13 MID-Res ± Mid 50 nM compared to MID-Sens cells ± Mid 50 nM (MID-Sens + Mid 50 nM versus MID-Sens − Mid (MV) p = 0.059, t = 3.4, df = 2.3 (MO) p = 0.07, t = 3.1, df = 2.3; MID-Res − Mid versus MID-Sens − Mid (MV) p < 0.01, t = 6.1, df = 3.8 (MO) p < 0.01, t = 5.7, df = 3.9; MID-Res + Mid versus MID-Sens (MV) p < 0.01, t = 10.03, df = 2.7 (MO) p < 0.01, t = 6.5, df = 3.4). f RAC1 activation was analyzed in FLT3 KD MV4-11/MOLM-13 MID-Res compared to scramble MV4-11 MID-Res cells ((MV) p < 0.01, t = 8.56, df = 2.9, (MO) p < 0.01, t = 5.1, df = 3.5). Relative light units (RLU). The western blot results are normalized by loading control (GAPDH) and are expressed as fold change relative to the control. Data are shown as means ± SDs (error bars) from three independent experiments.

