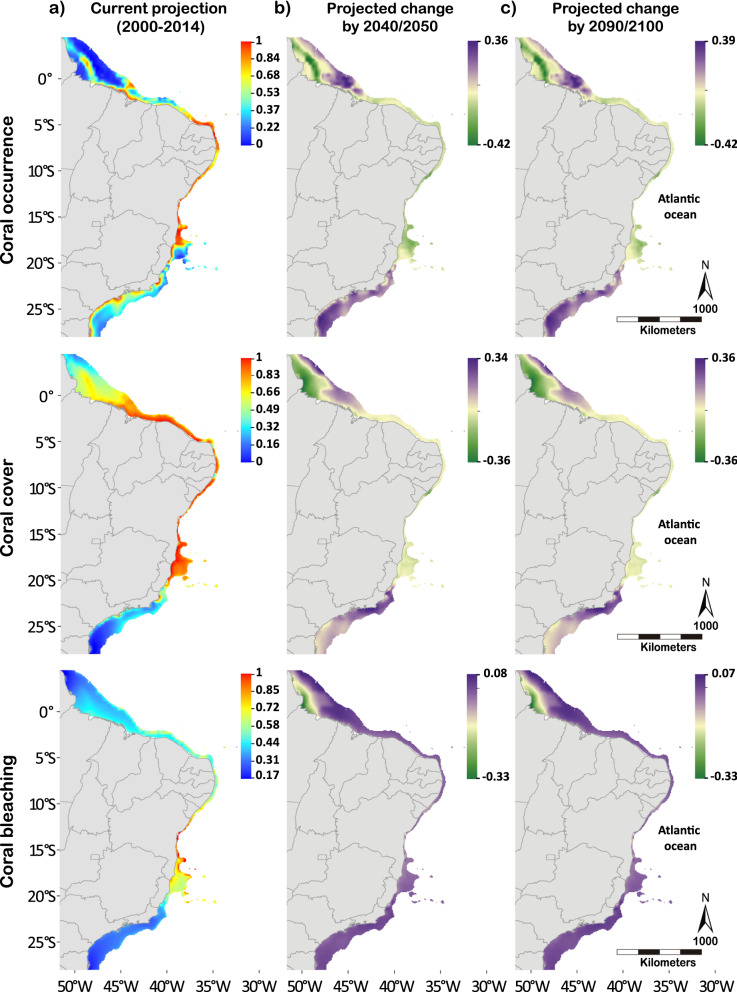
Figure 1.
Probability maps for current projections and delta maps of projected changes between current and future scenarios of coral occurrence, coral cover and coral bleaching along the Southwestern Atlantic coastline (1°N–27°S latitude). (a) The probability maps for coral occurrence, cover, and bleaching for the current scenario (2000–2014) and (b,c) delta maps between current and the future scenarios (2040–2050 minus 2000–2014, left; and 2090–2100 minus 2000–2014, right) under a “business as usual” warming rate (RCP 8.5). The blue-red and green-purple scale bars represent absolute probability values and delta probability values, respectively. Maps created in ArcMap version 10.2 (https://desktop.arcgis.com/en/arcmap/).

