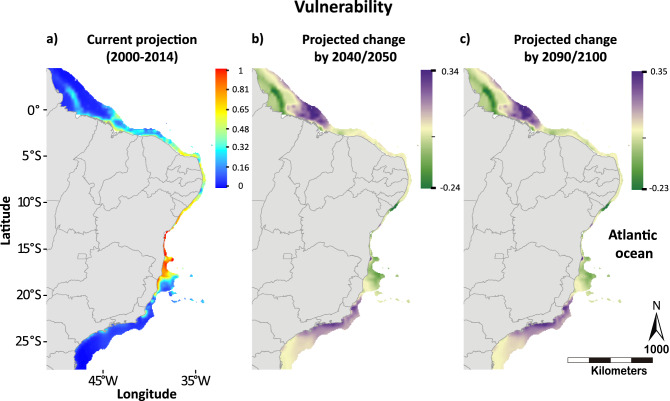
Figure 3.
Probability map of vulnerability for the current scenario and delta maps of projected changes between current and future scenarios. (a) Vulnerability areas based on the overlap of coral occurrence, coral cover and coral bleaching probabilities of the Brazilian coast for the current (2000–2014) scenario and (b,c) delta maps between current and the future scenarios (2040–2050 minus 2000–2014, left; and 2090–2100 minus 2000–2014, right) under a “business as usual” warming rate (RCP 8.5). The blue-red and green-purple scale bars represent absolute probability values and delta probability values, respectively. Maps created in ArcMap version 10.2 (https://desktop.arcgis.com/en/arcmap/).

