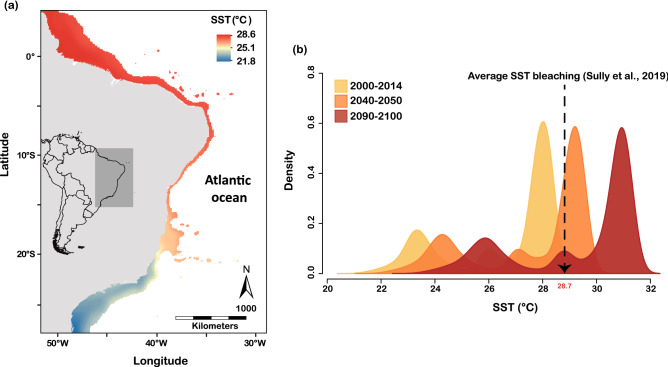
Figure 4.
Current and future sea surface temperature (SST) of the Brazilian coast from extracted values of the Bio-ORACLE database. (a) Current mean annual SST at the Brazilian coast and (b) the density of mean SST extracted along the Brazilian coast for current (2000–2014), and future 2040–2050 and 2090–2100 projected SST under a “business as usual” warming rate (RCP 8.5). The vertical dotted line and arrow points the average threshold SST (28.7 °C) recorded during global coral bleaching events between 2007 and 2017 (Sully et al., 2019). Note that the majority of the regions of mean SST for 2040–2050 and 2090–2100 will exceed mean SST bleaching for the current decade. Density was performed using the Kernel Density Estimation. The Map was created in ArcMap version 10.2 (https://desktop.arcgis.com/en/arcmap/) and the density graph was plotted using the package “yarrr”49 in R software50.

