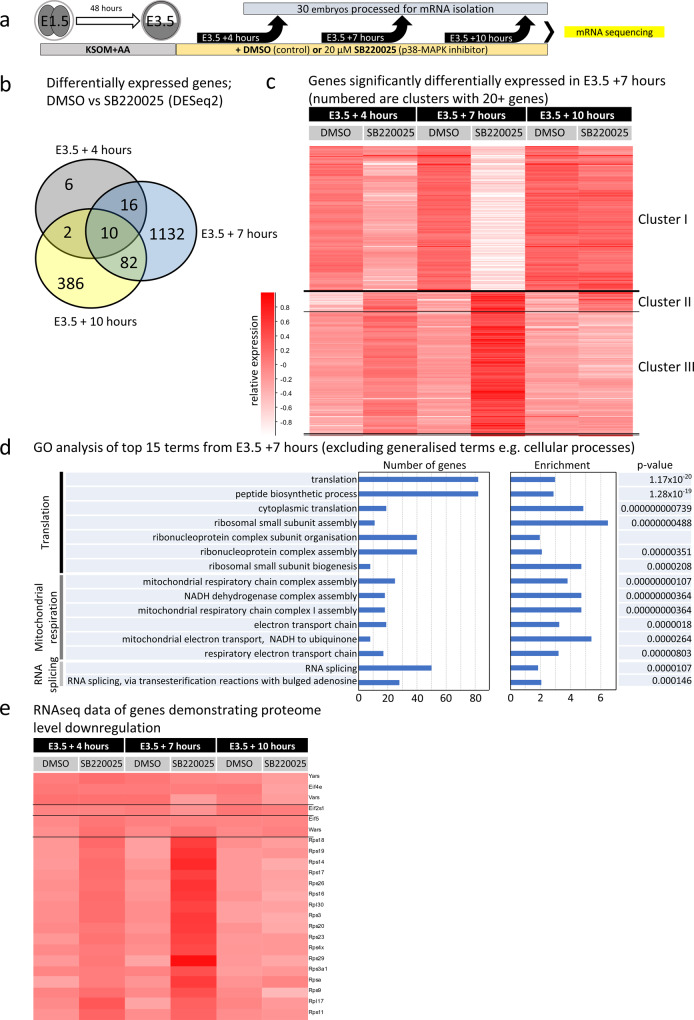
Fig. 3. Temporal transcriptomic analysis of the effects of p38-MAPKi during early blastocyst maturation.
a Experimental design for transcriptome sample collection for the control (DMSO) and p38-MAPKi (SB220025) conditions from E3.5 to +4, +7, or +10 h (biological duplicates of 30 blastocysts per condition were tested per time point). b Venn diagram showing the numbers of differentially expressed mRNAs (as determined by DESeq2 analysis) and their overlap between control and p38-MAPKi blastocysts at the three selected time points (i.e., E3.5 + 4 h, +7 h, and +10 h). c Hierarchical clustering heatmap depicting the expression of mRNAs that were significantly changed by p38-MAPKi at the +7 h time point and the transcript levels of those same genes at the +4 and +10 h time points. The mRNAs formed three distinct expression clusters. d Top 15 terms identified in GO enrichment analysis for the p38-MAPK-regulated transcriptome at the +7 h time-point (excluding generalized terms, e.g., cell). e Hierarchical clustering heatmap of genes originally identified as downregulated at the protein level and associated with translation-related GO terms after p38-MAPKi (Fig. 2b, c) at the three assayed early blastocyst ±p38-MAPKi time points.

