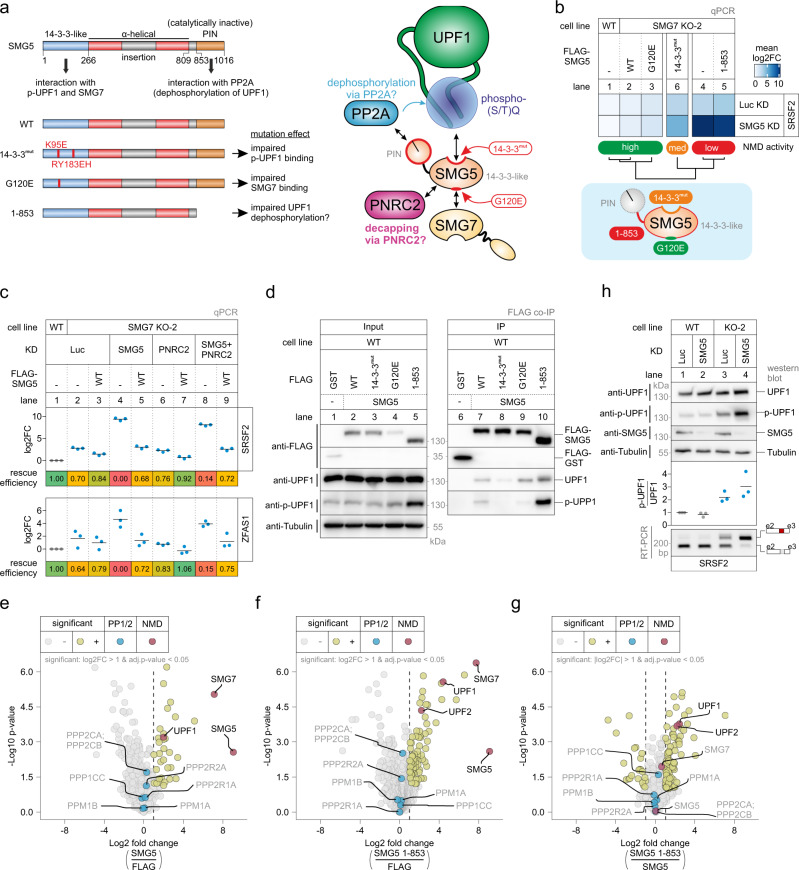
Fig. 3. SMG5 expression rescues the SMG7 KO phenotype.
a Schematic representation of the SMG5 domain structure on the left. The proposed functions of the domains are indicated and mutated constructs and their expected effect are shown below. The illustration on the right depicts which mutation is expected to impair which individual SMG5 function and/or protein-protein interaction. b Heatmap of quantitative RT-PCR-based detection (qPCR) of SRSF2 isoforms in the indicated cell lines upon treatment with the indicated siRNA and expression of the indicated FLAG-tagged rescue constructs. The ratio of NMD isoform to canonical isoform (SRSF2) was calculated; mean log2 fold change (log2FC) is shown (n = 3 biologically independent samples). The corresponding individual data points are plotted in Extended Data Fig. 4a. Clustering (k = 3) and functional summary of SMG5 mutations for NMD activity are depicted below. c Quantitative RT-PCR-based detection (qPCR) of SRSF2 isoforms and ZFAS1 was carried out in the indicated cell lines upon treatment with the indicated siRNA and expression of the indicated FLAG-tagged rescue constructs. The ratio of NMD isoform to canonical isoform (SRSF2) and ZFAS1 to the C1orf43 reference was calculated; data points and means from the qPCRs are plotted as log2 fold change (log2FC) (n = 3 biologically independent samples). Rescue efficiency was calculated based on the mean log2FC in relation lane 1 (set to 1) and lane 4 (set to 0). d Western blot after FLAG co-immunoprecipitation (IP) of FLAG-tagged GST (control) or SMG5 constructs in WT cells (n = 1). Tubulin serves as a control. e–g Volcano plots of mass spectrometry-based analysis of the interaction partners of FLAG-tagged SMG5 WT or 1-853 constructs in WT cells (n = 4 biologically independent samples). e SMG5 WT against FLAG control, (f) SMG5 1-853 against FLAG control, (g) SMG5 1-853 against SMG5 WT. The yellow color labeling indicates targets that are significant in the respective comparisons after two-sided Welch’s t-testing (log2 fold change (log2FC) >1 or |log2FC| >1; and adj. p-value <0.05). Points labeled in blue indicate phosphatase subunits of interest; points labeled in red indicate NMD factors. Highlighted proteins that were not significant in the respective comparisons are labeled with gray text. h Analysis of endogenous UPF1 serine 1127 (S1127) phosphorylation status in the indicated cell lines and knockdown conditions. Quantification results of phosphorylated UPF1 (p-UPF1) vs. total UPF1 are shown as data points and mean (n = 3 biologically independent samples). Knockdown of SMG5 protein as a western blot (n = 2 biologically independent samples) and the functional impact on SRSF2 isoform distribution (End-point RT-PCR as in Fig. 1c; n = 3 biologically independent samples) is shown.

