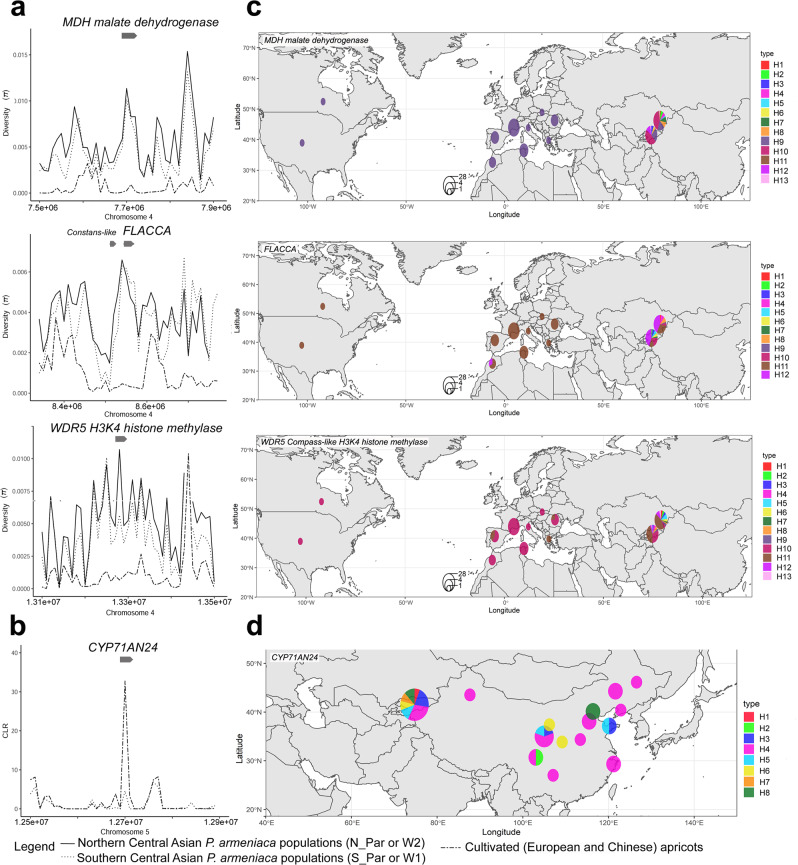
Fig. 7. Examples of four genes with footprints of positive selection.
Nucleotide diversity (a) composite likelihood ratio (b) and haplotype distribution of four candidate genes under selection during the domestication of European (c) or Chinese (d) apricots. a Nucleotide diversity (π) plots and (c) geographic distribution of alleles at malate dehydrogenase (MDH), FLACCA and WD-repeat protein-5 (WDR5) loci in European apricots and Northern and Southern Central Asian P. armeniaca natural populations. b Composite likelihood ratio and (d) geographic distribution of alleles at the cytochrome P450 71AN24 (CYP71AN24) locus in Chinese apricots and Southern Central Asian P. armeniaca natural populations. Grey arrows at the top of the plots indicate the position of the candidate genes; black line, Northern P. armeniaca wild natural populations (W2 or N_Par); dotted line, Southern P. armeniaca wild natural populations (W1 or S_Par); broken line, cultivated European or Chinese apricots. See Fig. 6b for diversity scans across the whole chromosome 4. Note that the Constans-like haplotype distribution is similar to the FLACCA haplotype distribution, being very close (22 Kb apart) over the interval. H1 to H13 refer to the haplotypes identified in wild and cultivated apricots. For all panels, the different haplotypes of the focal gene are represented by different, arbitrary colors. The world map layout was generated by the ggplot2 R package. Source data underlying Fig. 7c and 7d is provided as a Source Data file.

