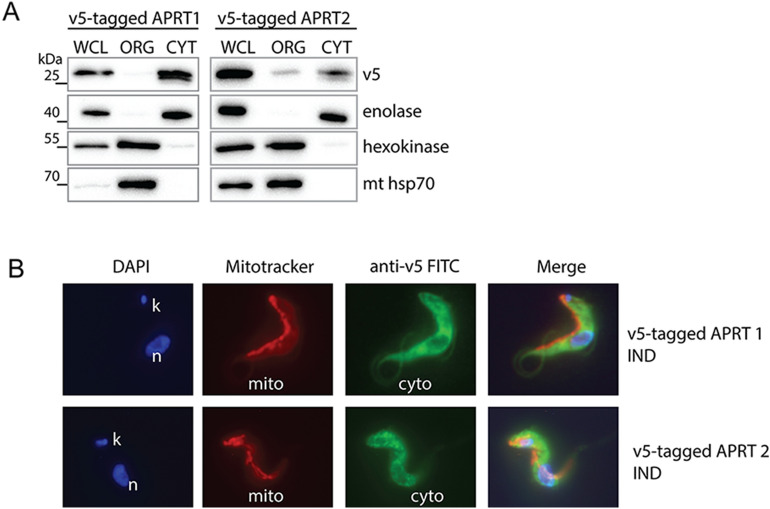
Figure 2.
Subcellular localization of APRT1 and 2 in the BSF T. brucei cells. (A) Western blot analysis of the BSF cells overexpressing V5-tagged APRT1 and 2 which were treated with digitonin to obtain cytosolic and organellar fractions. The purified fractions were analysed with the following antibodies: anti-V5, anti-enolase (cytosol), anti-hexokinase (organellar fraction, glycosomes), and anti-mt hsp70 (organellar fraction, mitochondria). The protein marker is indicated on the left. (B) Immunofluorescence microscopy of the tetracycline induced (IND) V5-tagged APRT1 and 2. The tagged proteins were visualized using a monoclonal V5-antibody and an anti-mouse secondary antibody conjugated with fluorescein isothiocyanate (FITC). The MitoTracker Red was used to visualize mitochondria, while the DAPI was used to stain the DNA content [nucleus (n) and kinetoplast (k)] of the cell. WCL whole cell lysate, ORG organellar fraction, CYT cytosolic fraction.

