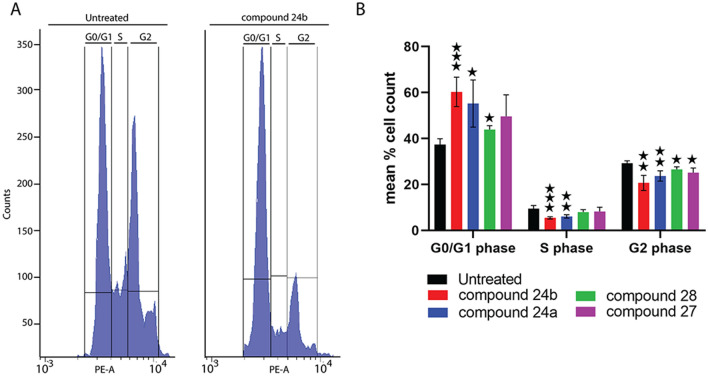
Figure 8.
Flow cytometry analysis of DNA content of T. brucei cells treated with selected ANPs 24a, 24b, 28 and 27 at the concentration ranging from 1 to 16 µM depending on the tested inhibitor. Histograms show the distribution of DNA content of trypanosomes after exposure to selected ANPs. (A) Fluorescence intensity in the PE-A channel is shown on the x axis and number of cells on the y axis (example for 24b); (B) Bar chart displaying the percentage of cell at G0/G1, S and G2 phase. (means ± S.D., n = 3–7, Student’s unpaired test, ***p < 0.001, **p < 0.01, *p < 0.05).

