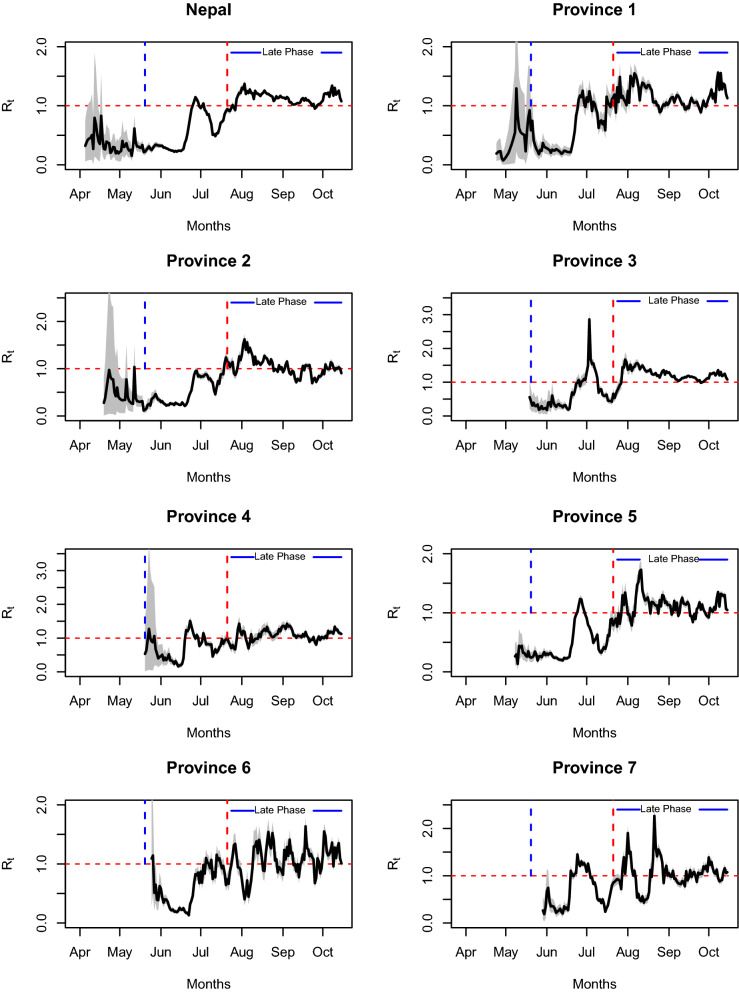
Figure 4.
The time-dependent effective reproduction number of COVID-19 for Nepal and its seven provinces during 2020 pandemic. The gray shaded region is the 95% confidence interval for . The solid curve in the middle of the gray area is the average effective reproduction number. The vertical blue dotted lines indicate the start date of border opening with screening and the vertical red dotted lines indicate the date at which the countrywide lockdown was ended, after which the epidemic is described as the late phase (solid blue line). The horizontal red dotted lines indicate the effective reproduction number of 1.

