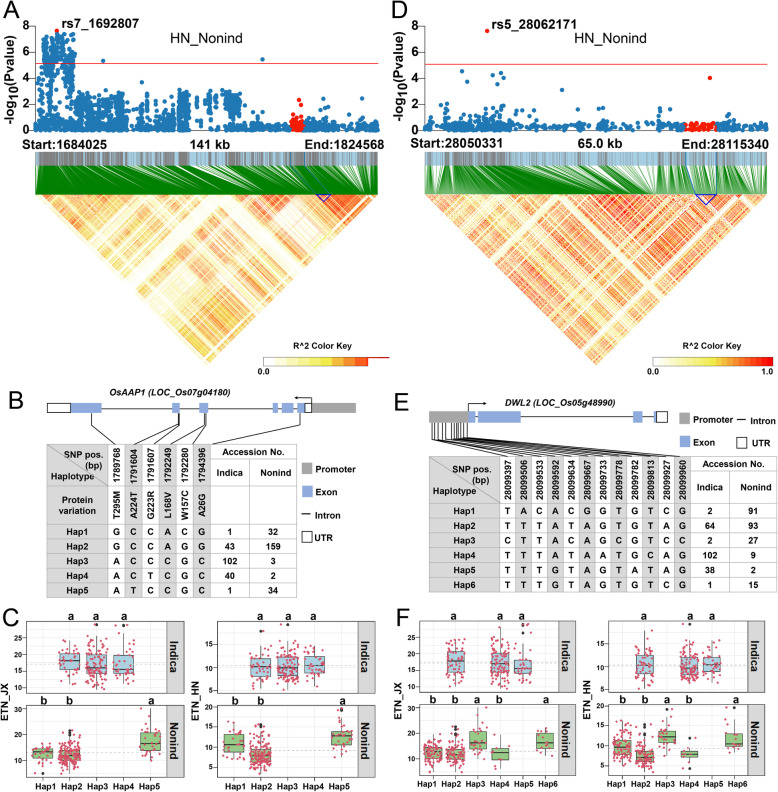
Fig. 3.
Associated region and haplotype analysis of OsAAP1 and DWL2. (a, d) Regional Manhattan plots and LD heatmap of OsAAP1 (a) and DWL2 (d). The single red dot above the red line denotes the lead SNP, the red dots under the red line and the blue triangle in the LD heatmap denote the genomic region of candidate genes. (b, e) Gene structure and marker information of OsAAP1 (b) and DWL2 (e). Arrow heads indicate the direction of gene transcription. (c, f) Haplotype analysis of OsAAP1 (c) and DWL2 (f). Boxplot described ETN distribution of one subpopulation with one haplotype, and each red dot around the boxplot represents ETN value of one accession. The gray dotted-lines denote average ETN of one subgroup. Different letters denote significant differences (P < 0.05) based on Duncan’s multiple-range test

