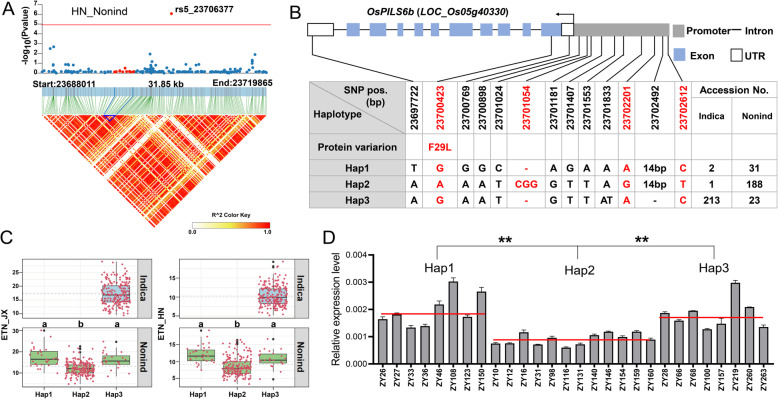
Fig. 5.
Haplotype and transcription analysis of OsPILS6b. (a) Regional Manhattan plots and LD heatmap of OsPILS6b. (b) Gene structure and SNP information of OsPILS6b. Red characters marked the specific variations for Hap2. The 14-bp deletion in Hap3 is AAAATGGCGGATTG. (c) Haplotype analysis of OsPILS6b. Boxplot described ETN distribution of one subpopulation with one haplotype, and each red dot around the boxplot represents ETN value of one accession. The gray dotted-lines denote average ETN of one subgroup. Different letters denote significant differences (P < 0.05) based on Duncan’s multiple-range test. (d) The relative expression level of OsPILS6b in plants with different haplotypes. Red lines represent the average expression level of accessions with three haplotypes, respectively. “ZYx” is the field number and the detailed information was listed in Additional file 1: Table S1. Data are mean ± SEM, ** means Student’s t-test, P < 0.01

