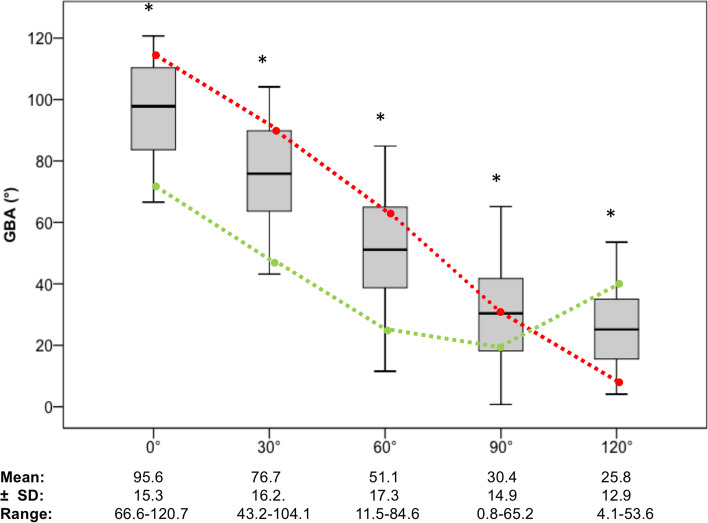
Fig. 5.
Mean graft bending angle (GBA) for all subjects and FTE among flexion grades. GBA: Graft bending angle. SD: Standard deviation. Boxplots depicts mean (line), 1st and 3rd quartile (box), minimum and maximum (whisker). Significant differences between groups after Bonferroni correction marked with * (90° vs. 120° p = 0.002), remaining: p < 0.001; ANOVA). Red dotted line: FTE with the greatest mean GBA-excursion; ΔGBA = 102.1 ± 6.3° (most distal-anterior FTE). Green dotted line: FTE with the smallest mean GBA-excursion; ΔGBA = 21.7 ± 6.9° (most proximal-posterior FTE)

