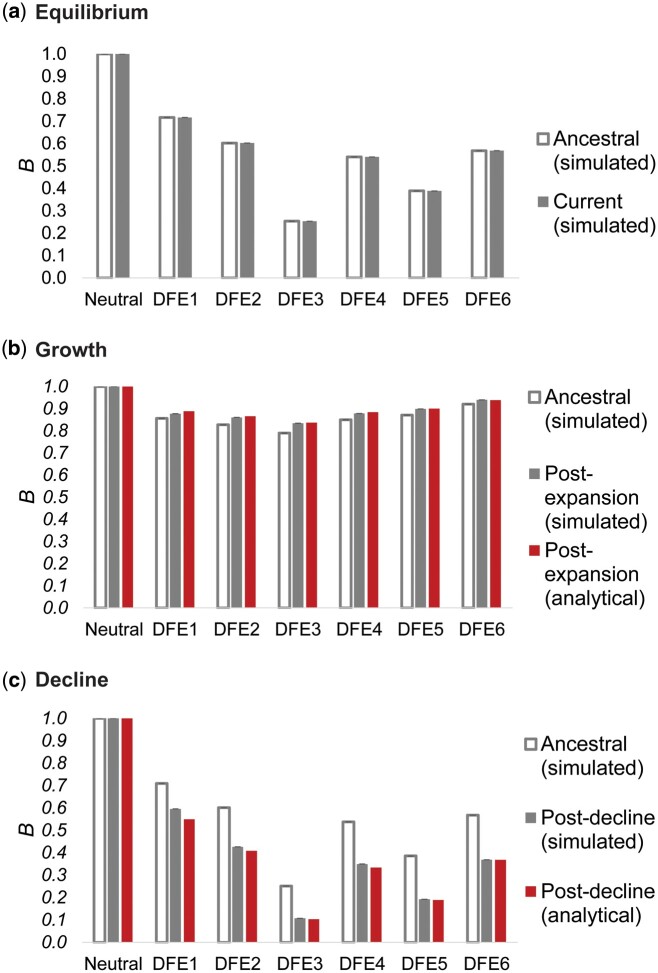
Fig. 4.
Nucleotide site diversity with BGS (B) relative to its purely neutral expectation (π0) for varying DFEs (specified in table 1) and demographic scenarios. The results are shown for (a) demographic equilibrium, (b) population growth, and (c) population decline. All cases refer to size changes forward in time, the ancestral B (i.e., B pre-change in population size) is shown in white bars, B post-change in population size is shown in solid gray bars, and the analytical expectations for the post-size change B are shown as red bars. Exonic sites comprised ∼10% of the genome, roughly mimicking the density of the human genome. Detailed methods including command lines can be found at: https://github.com/paruljohri/demographic_inference_with_selection/blob/main/CommandLines/Figure4.txt.

