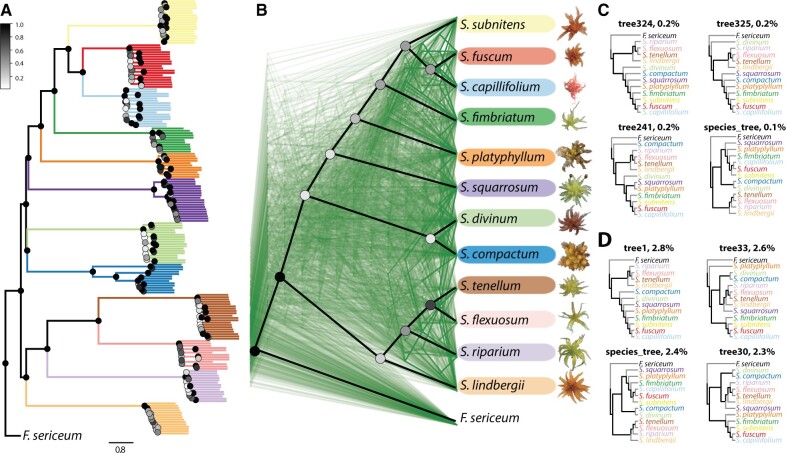
Fig. 4.
The coalescent- and sliding-window based phylogenies. (A) The coalescent-based species tree. The node color represents ASTRAL local posterior support according to the scale shown on the left. Color of branches refers to the species as on (B), length of the branches is in coalescent units as shown at the bottom. (B) Cladograms of the coalescent-based species tree (heavy black lines) and of 500 gene trees (in green) randomly sampled from 988 inferred gene trees. Each species is downsampled to one sample (supplementary table S1, Supplementary Material online). The node color represents node recovery (concordance factor), that is, the fraction of all gene trees recovering a particular node, according to the scale shown on the left. Photos of capitula were taken by Kjell Ivar Flatberg. (C) The most common topologies in gene trees and (D) in 100-kb sliding-window trees, the number represents the percentage of trees with the given topology.

