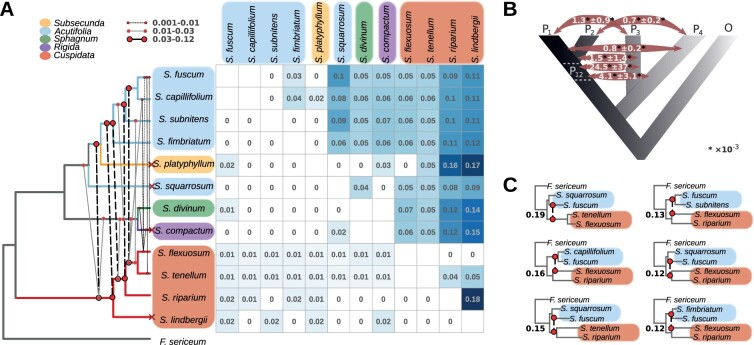
Fig. 5.
Tests for introgression. (A) Mean pairwise D per species pair (upper diagonal) and the mean total proportion of introgressed loci per species pair inferred through the QuIBL analysis (lower diagonal). Empty squares correspond to the pairs that have not been tested since they are sister species in our data set, and 0 values correspond to nonsignificant values. The nuclear-based cladogram is shown on the left, red cross symbols designate the species that are placed in disagreement with the plastid-based phylogenies. The color of boxes and branches represents the subgenus as shown on the top left. The cladogram includes lines schematically representing interspecific introgression events based on summarized results of the DFOIL analysis. The color and shape of the lines indicate the average portion of windows supporting introgression between the branches as shown on the top. (B) Schematic summary of results of DFOIL analysis on a five-taxon phylogeny with four in-group taxa (P1−P4) and an outgroup (O), P12 is an ancestral branch. The numbers correspond to the proportion of introgressed windows for the corresponding type of introgression (P1⟺P3, P2⟺P3, P2⟺P4, P12⟺P3, P12⟺P4) averaged in all tested five-taxon topologies followed by its standard deviation. (C) Fixe-taxon phylogenies with the highest proportion of introgressed windows inferred with the DFOIL analysis. The phylogenies include lines, which represent introgression events as in (A), the numbers represent the corresponding proportion of windows showing ancient introgression to the total number of windows analyzed for the phylogeny. Color of species names highlights represents the subgenus the species belongs to as in (A).

