
Figure 3.
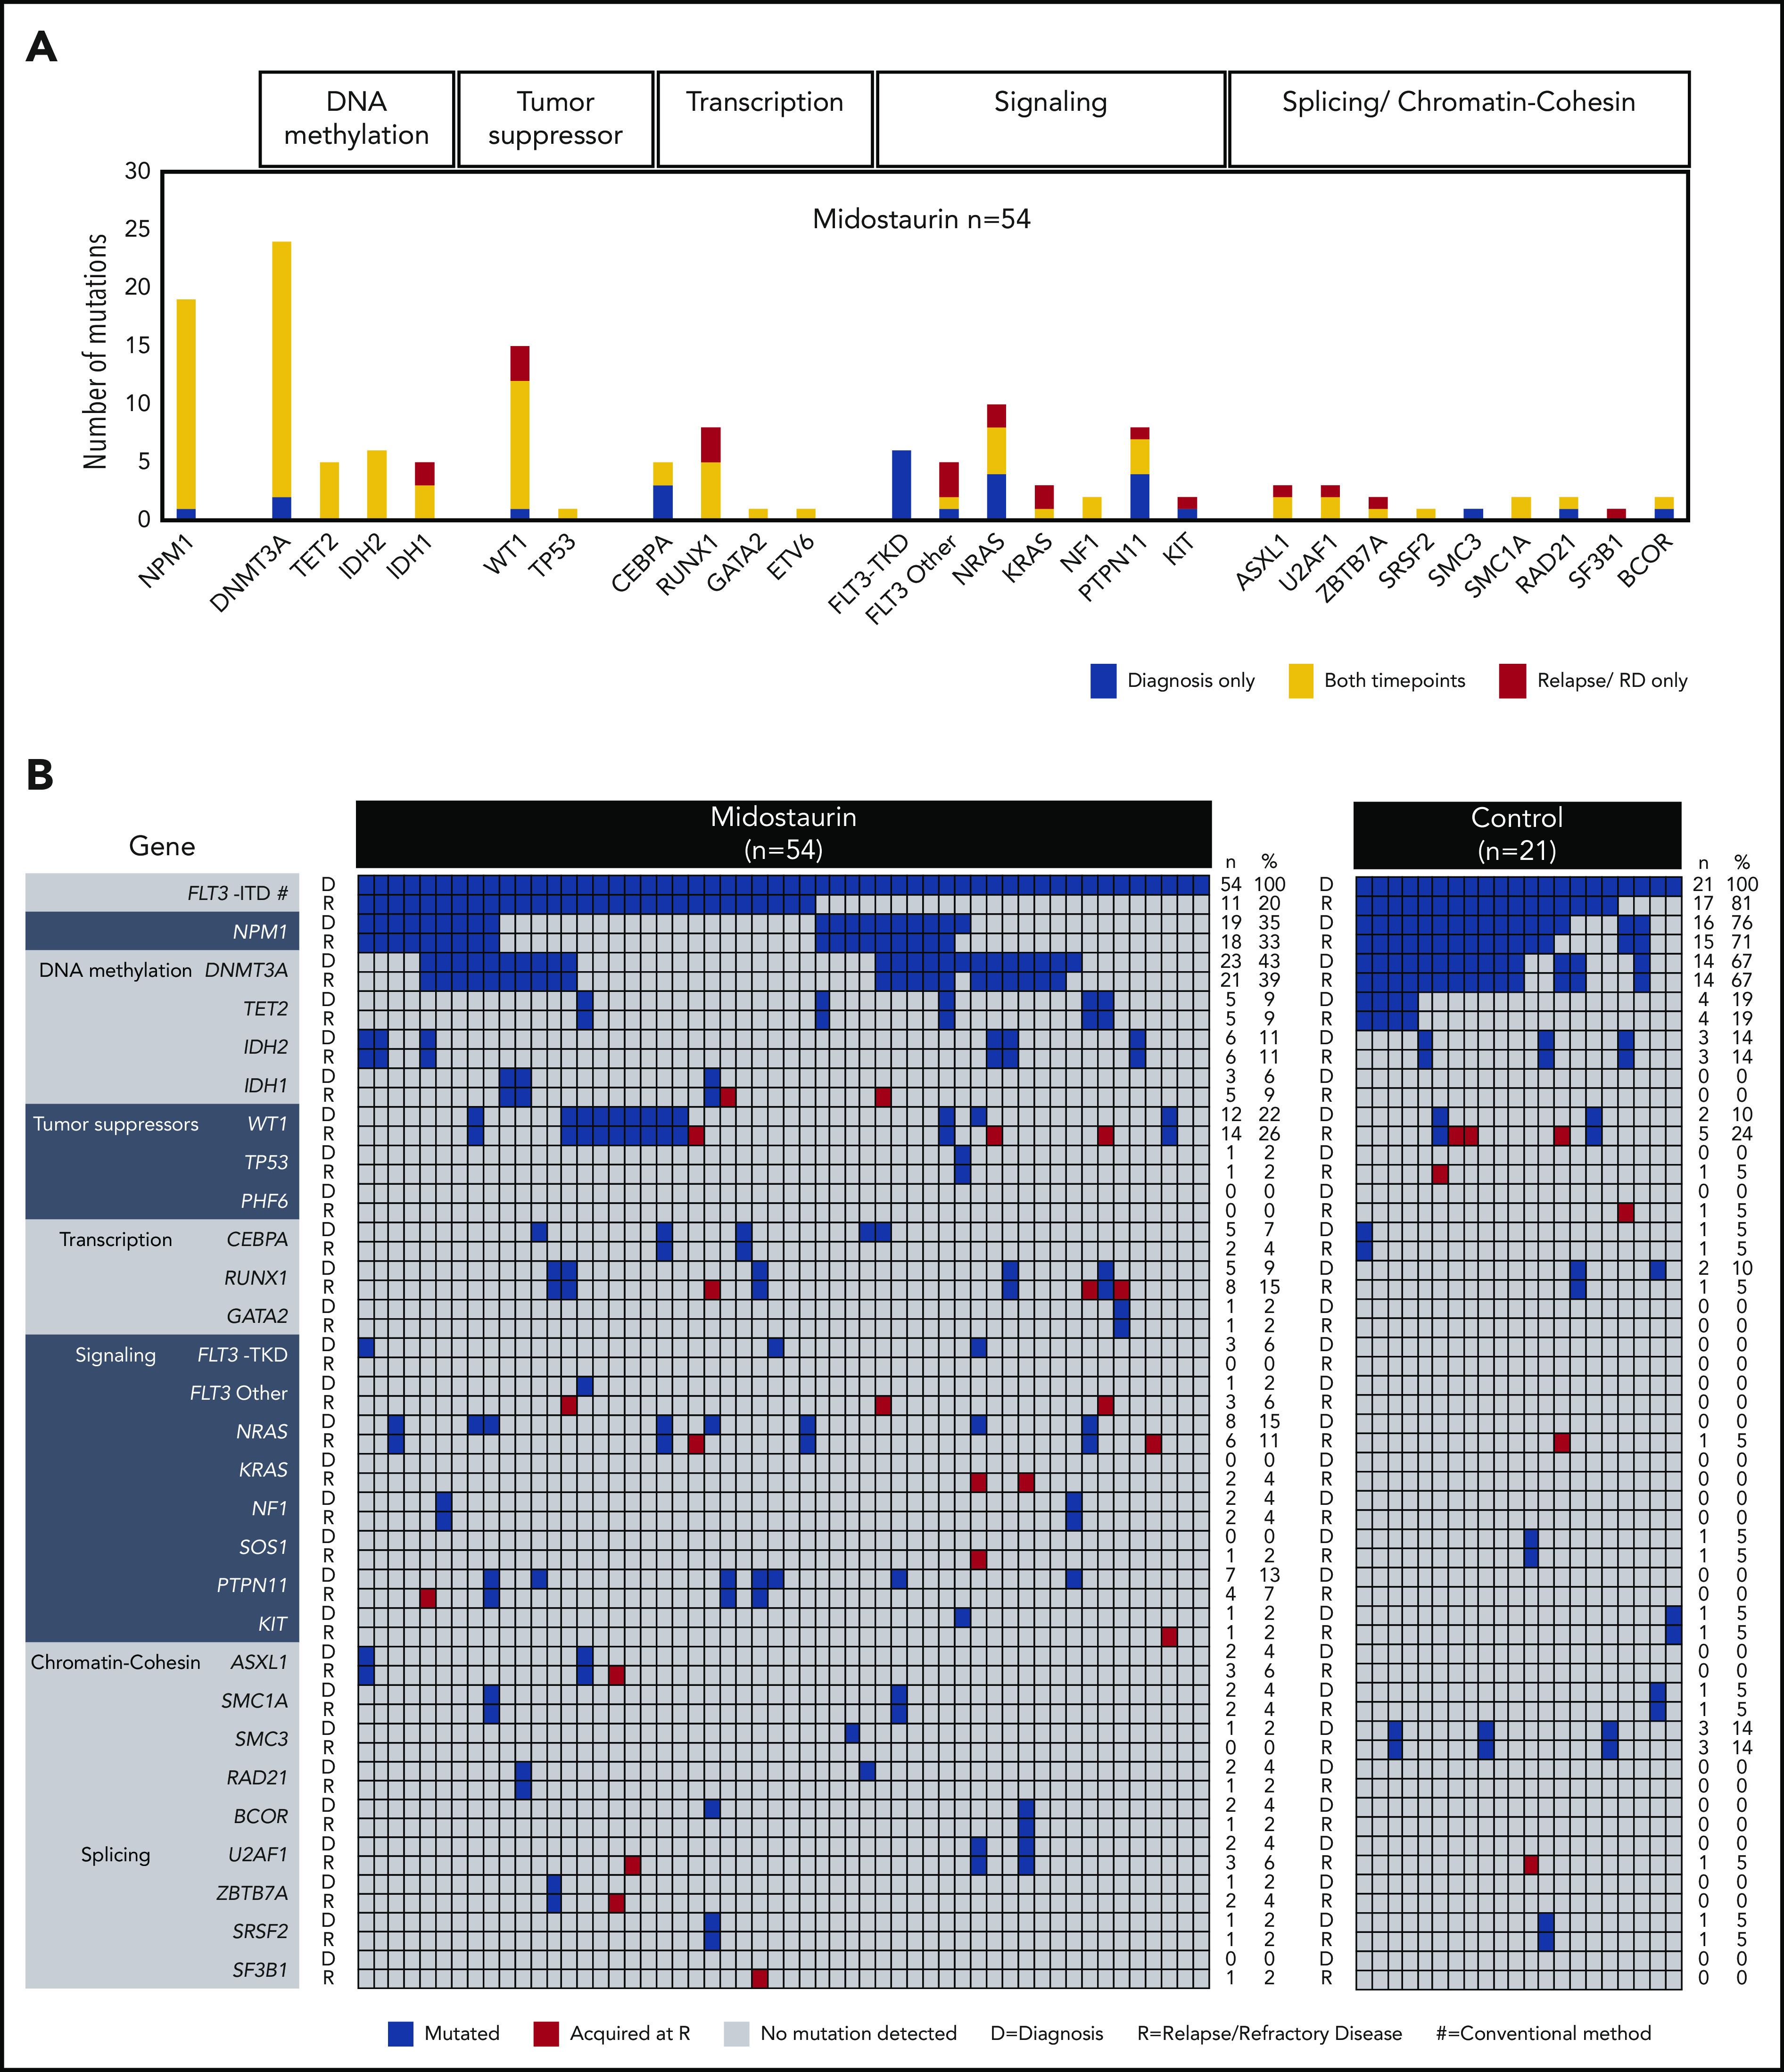
Recurrently mutated genes at D and at R. (A) Frequencies of recurrent gene mutations in all patients treated with midostaurin (n = 54) present only at D (blue), only at R (red), and at both time points (yellow). Genes are arranged according to functional groups as described at the top of the graph. (B) Presence of gene mutations in patients treated with midostaurin and the control group at D and R. Genes are arranged with regard to functional groups. Each column represents a single patient. For each patient, the presence of mutations is given at both time points in subsequent rows. Blue, presence of a mutation; gray, wild type. Mutations present only at R are highlighted in red. The number (n) and percentage (%) of mutations at the respective time points are given next to the figures.