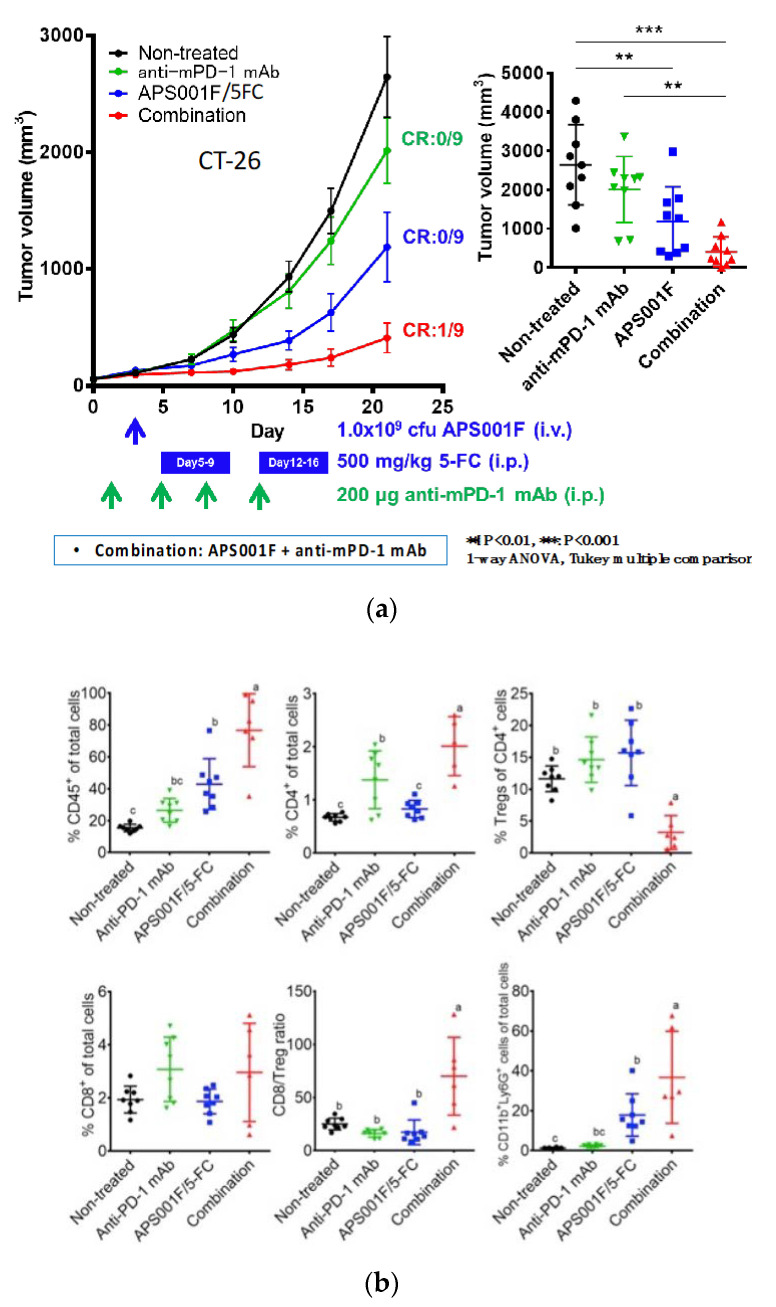
Figure 4.
Anti-tumor effects of APS001F/5FC, anti-PD-1 mAb, and their combination were evaluated in a syngeneic CT26 mouse model. Experiment schedule. Mice were s.c. inoculated with 1 × 10⁵ CT26 cells (day -13), and stratification was done on day 0. APS001F was administered i.v. at 1.0 × 10⁹ c.f.u./mouse via the tail vein on day 3 with 200 mg maltose supplementation (days 3 through 16). 5-FC was administered i.p. at 250 mg/kg twice a day (500 mg/kg/day) on days 5 through 9 and days 12 through 16. Anti-PD-1 mAb was administered i.p. at 200 µg/mouse on days 1, 4, 8, and 11. Tumor volume was measured twice a week. (a) Change in tumor volume after treatment with APS001F/5-FC, anti-PD-1 mAb, and their combination. Results are the mean ± standard error of the mean of 9 mice. Analyses of 4 groups on day 21 were conducted using Tukey’s method of multiple comparisons. Means sharing a letter are not significantly different. Tumor Growth Inhibition was calculated on day 21. (b) Flow cytometric analysis of tumor cells in mice engrafted with CT26 cells. Results are the mean ± standard deviation of 8 mice. %CD45+ of total cells, %CD4+ of total cells, %Tregs (CD45+ CD4+ CD25+ Foxp3+ cells) of CD4+ cells, %CD8+ of total cells, CD8/Treg ratio, and %neutrophils (CD45+ CD11b+ Ly-6G+ cells) of total cells, and %TAMs (CD45+ CD11b+ Ly-6G−Ly-6Clow cells) of total cells were analyzed. Analyses of 4 groups were conducted using Tukey’s method of multiple comparisons. Means sharing a letter are not significantly different. This figure was adopted from a previous study [48].

