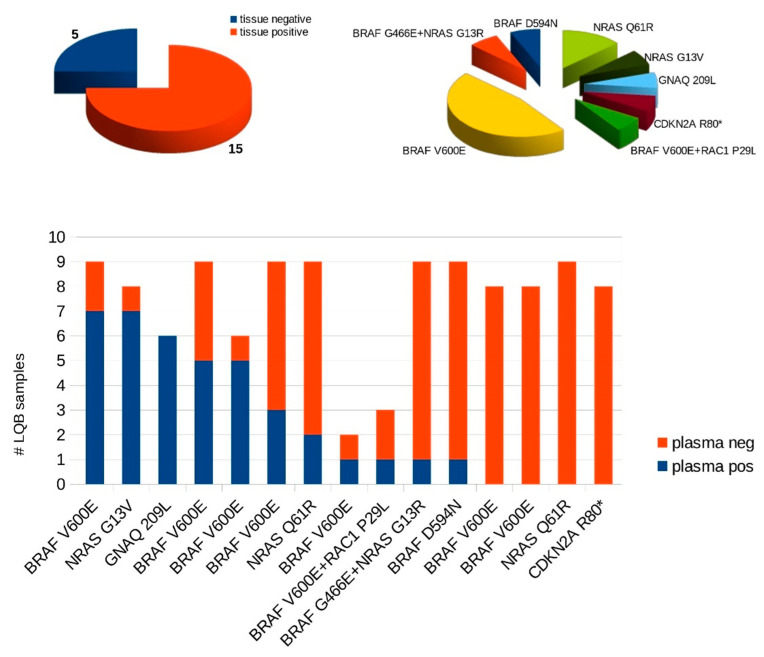
Figure 2.
Pie charts showing ratio of tissue positive to tissue negative patients in our cohort (n = 20), as well as proportions of detected cancer-associated mutations in tissue specimens. Bar chart illustrates number of ctDNA positive or negative plasma samples per patient in tissue positive patient cohort (n = 15). Each bar chart represents one patient. #LQB, cumulative number of liquid biopsy samples; *, stop mutation.

