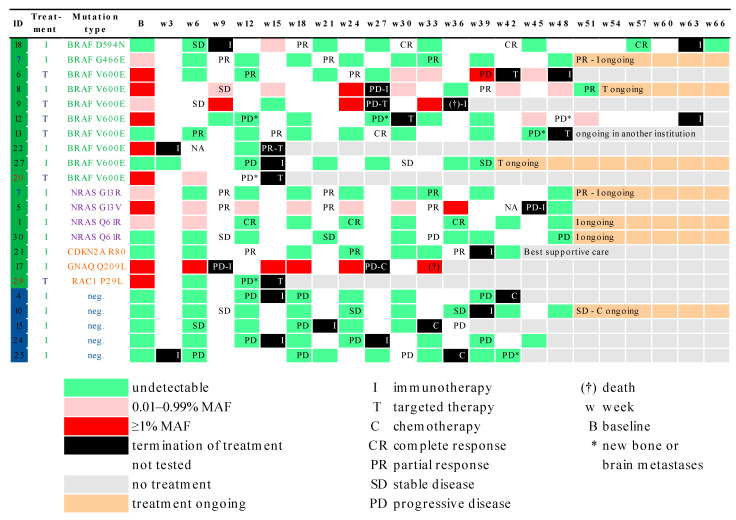
Figure 3.
Heatmap showing mutation status and longitudinal ctDNA followup of individual patients at different time points during treatment (immunotherapy or targeted therapy) grouped by mutational status in the tissue/plasma (at least one melanoma-associated mutation detectable in tissue/plasma or tissue/plasma negative). Each row is an individual patient, and each column is a time point during followup (every three weeks). Termination of each treatment type is marked in black boxes. Grey boxes signify that patient did not receive treatment with either immunotherapy, targeted therapy, or chemotherapy anymore. MAF levels are marked by green boxes (undetectable), pink boxes (0.01–0.99% MAF), and red boxes (≥1% MAF). Time points at which there was no evaluation of ctDNA are shown in white color. Two patients had two different mutations in tissue as well as in the plasma samples and are listed twice in heatmap (ID 7 in blue and ID 29 in red). MAF: mutant allele frequency.

