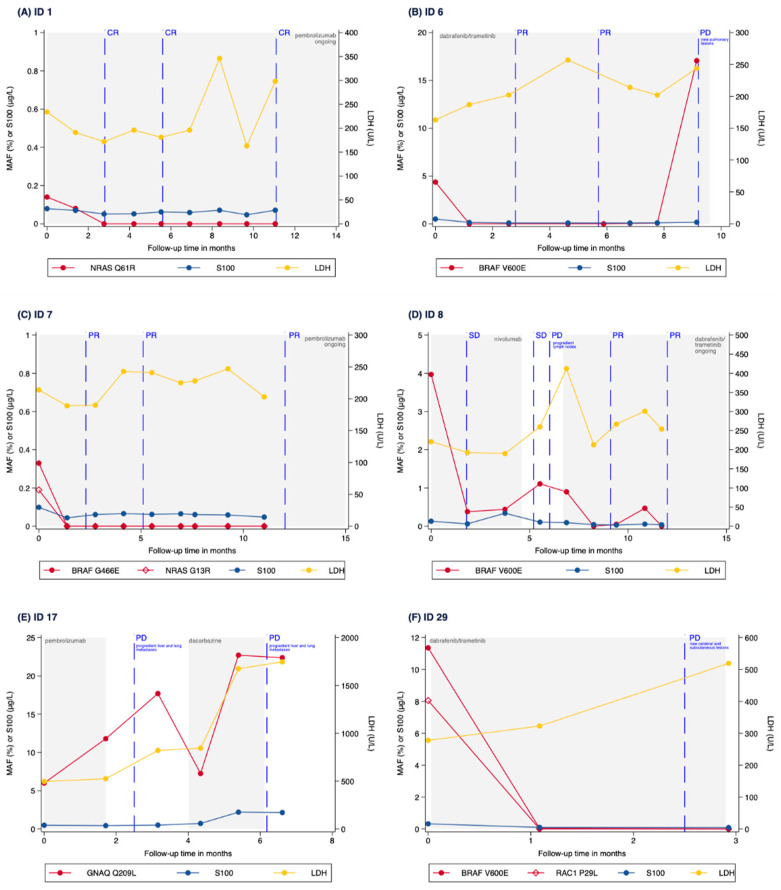
Figure 6.
(A) Time course of a patient (ID 1) with MAF levels monitored through a NRAS Q61R mutation during pembrolizumab treatment. MAF decreases under pembrolizumab treatment and becomes undetectable, while radiologically displaying complete response to treatment. (B) Time course of a patient (ID 6) with MAF levels monitored through a BRAF V600E mutation in plasma during dabrafenib/trametinib treatment. MAF decreased and became undetectable prior to radiological evidence of partial response to treatment. In the further course, MAF increased again, while CT scans showed newly developed lesions in the lung. (C) Time course of a patient (ID 7) with MAF levels monitored through both a BRAF G466E and a NRAS G13R mutation in plasma during pembrolizumab treatment. MAFs of both mutations fell and became undetectable after initiation of pembrolizumab, preceding CT scans displaying partial response to treatment. (D) Time course of a patient (ID 8) with MAF levels monitored through a BRAF V600E mutation in plasma during nivolumab and subsequent dabrafenib/trametinib treatment as well as during a treatment pause in between. The MAF of the BRAF mutation rose before radiological disease progression and fell after change of treatment regimen. (E) Time course of a patient (ID 17) with uveal melanoma and MAF levels monitored through a GNAQ Q209L mutation in plasma during pembrolizumab and subsequent dacarbazine (DTIC) treatment as well as during a treatment pause in between. MAF of the mutation increased during and after pembrolizumab treatment and showed a decline after initiation of dacarbazine chemotherapy. However, soon after this, the patient displayed again increasing GNAQ Q209L MAF as well as increasing S100 and LDH levels, preceding the radiological progression under chemotherapy. (F) Time course of a patient (ID 29) with MAF levels monitored through both a BRAF V600E and a RAC1 P29L mutation in plasma during dabrafenib/trametinib treatment. MAFs of both mutations fell during the first weeks of treatment and remained undetectable in further course, while CT scans showed new subcutaneous and brain lesions. Scales on axes are not normalized to better display dynamics. MAF: mutant allele frequency; LDH: lactate dehydrogenase; CR: complete response; PR: partial response; SD: stable disease; PD: progressive disease.

