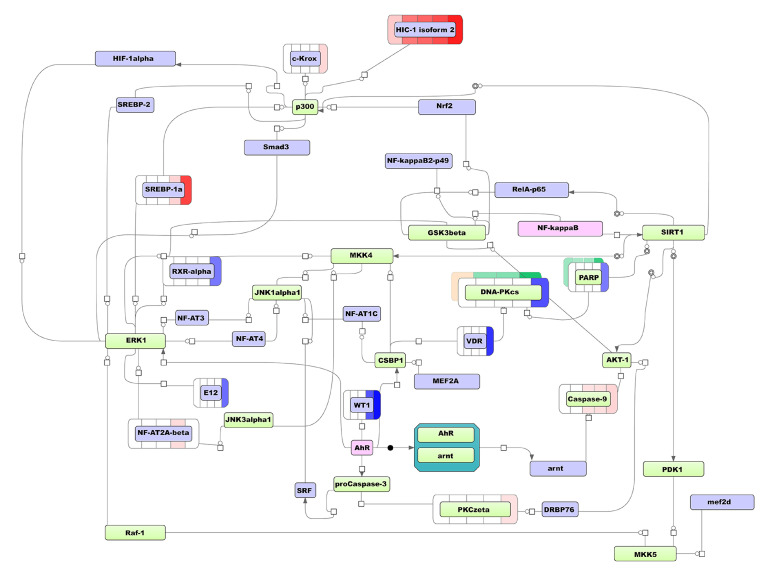
Figure 4.
The transcriptome-based model network of regulation of MCD group DEGs during ATRA-induced HL-60 cells differentiation (the time points 3 h, 24 h, and 96 h). Legend: master regulatory molecules are represented by pink ellipses; connecting molecules considered by the graph-analyzing algorithm to find the path from the TF input list to the master molecule are represented by green ellipses; the molecules from the TF input list are represented by lilac ellipses. The colored bars around molecules show changes in the expression level. Transcript expressions are shown in blue (decreased expression) or pink (increased expression) color arrays, color intensity correlates with fold-change (FC), bars are colored if FC ≥ 2. From left to right each bar represent experimental time point (the time points at 3 h, 24 h, and 96 h and additional time points at 0.5 h and 1 h). Protein expression is shown in yellow (decreased expression) and green (increased expression) color array, color intensity correlates with fold-change (FC) of relative protein expression, bar is colored if FC ≥ 1.5, from left to right each bar represent experimental time point (3 h, 24 h, 48 h, and 96 h).

