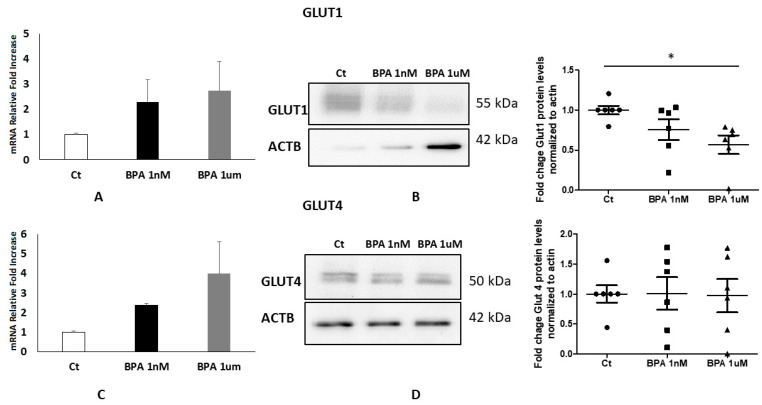
Figure 4.
GLUT 1 and 4 expressions (A,C) and protein levels (B,D) in placenta explants treated with BPA from overweight women. (A) Fold Change of GLUT1 mRNA in placental explants from OW women (n = 5) treated with BPA 1 nM and BPA 1 μM compared to the vehicle as control. (B) Representative WB (left panel) and corresponding densitometry (right panel) of GLUT1 in placental explants from OW women (n = 6) treated with BPA 1 nM and BPA 1 μM compared to the vehicle as control. (C) Fold Change of GLUT4 mRNA in placental explants from OW women (n = 5) treated with BPA 1 nM and BPA 1 μM compared to the vehicle as control. (D) Representative WB (left panel) and corresponding densitometry (right panel) of GLUT4 in placental explants from OW women (n = 6) treated with BPA 1 nM and BPA 1 μM compared to the vehicle as control. Data are presented as mean ±ES. Significance was determined using a one-way ANOVA and Bonferroni’s test for post hoc comparisons * p < 0.05. Ct: control.

