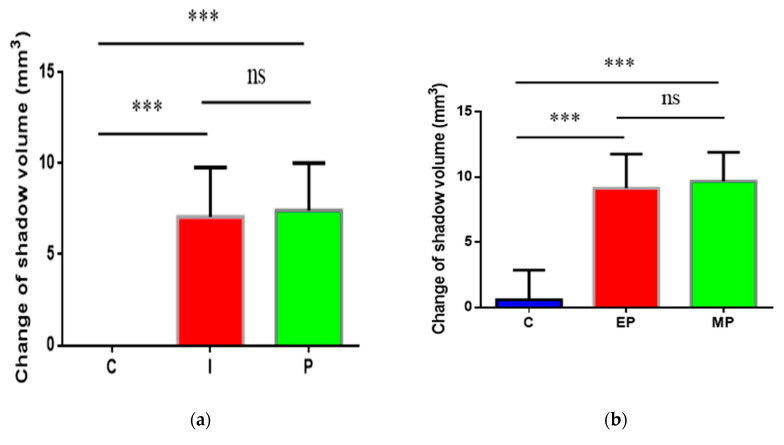
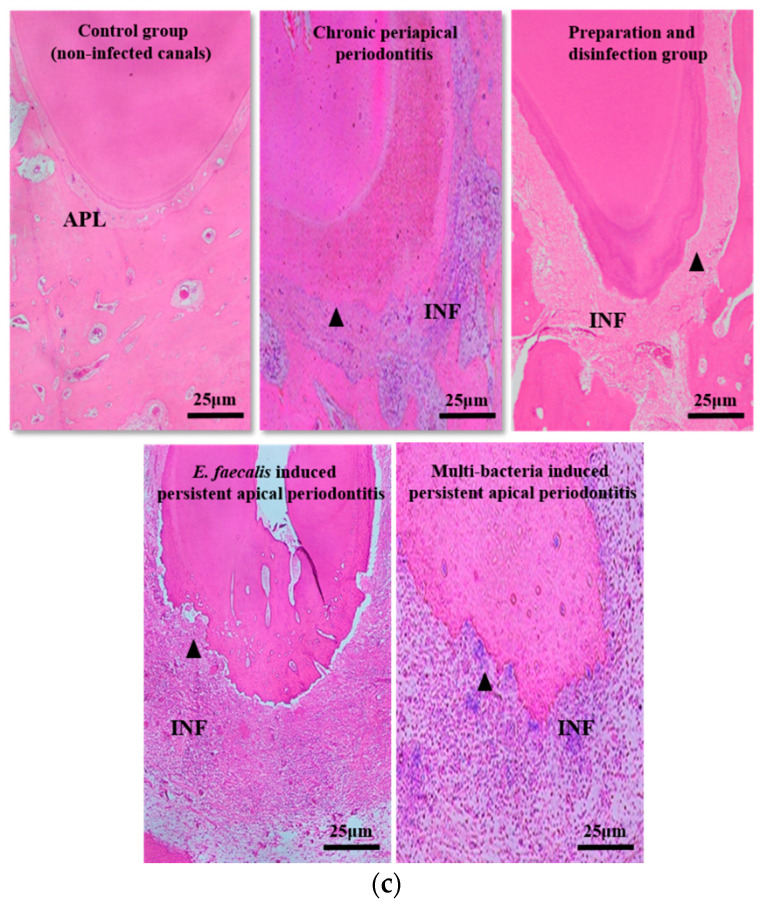
Figure 2.
The volume and histopathological section of periapical lesions in each time point. (a) “C” represents the control group (non-infected canals), “I” represents the initial chronic AP group and “P” represents the root canal preparation and disinfection group; (b) “C” represents the control group (injected with sterile normal saline), “EP” represents E. faecalis-induced persistent AP and “MP” represents multi-bacteria-induced persistent AP; (c) histopathological images in each time points. Apical periodontal ligament (APL), areas of apical resorption (triangle), and chronic inflammatory reaction (INF) in the apical periodontal space. The apical shadow volume was tested through CBCT and calculated by MIMICS V21.0. Each value is mean ± SD (n = 6) (*** p < 0.001).


