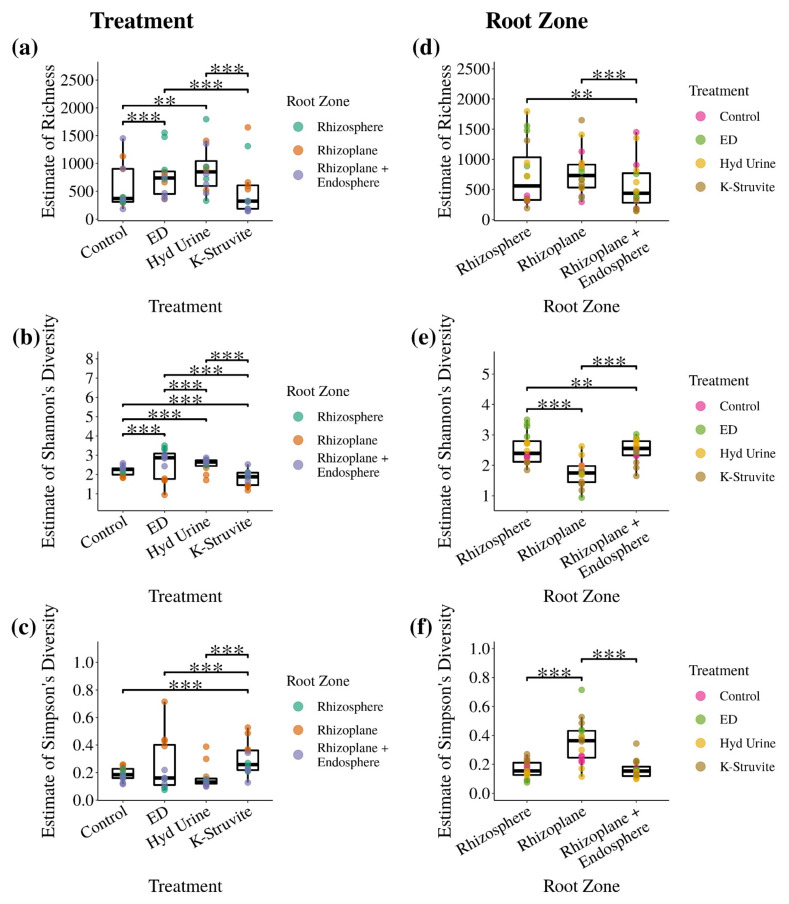
Figure 3.
Boxplots of the richness, Shannon’s diversity, and Simpson’s alpha diversity indices of the lettuce root-associated bacterial communities grouped per urine-derived fertilizer treatment (ED: electrodialysis concentrate, Hyd Urine: hydrolyzed urine) (a–c) or root zone (d–f). The alpha diversity indices were estimated by taking unknown taxa into account. Shannon’s diversity and Simpson’s diversity indices were determined at the genus level. Statistical comparison of the alpha diversity indices between urine-derived fertilizer treatments or root zones using the estimates’ variance in a mixed model approach. When fitting the model with urine-derived fertilizer treatment as a fixed effect, the root zone was added as a random effect and vice versa. Only significant pairwise comparisons are shown. Asterisks indicate level of significance: p < 0.01 (**) and p < 0.001 (***). N per urine-derived fertilizer treatment = 12 and n per root zone = 16.

