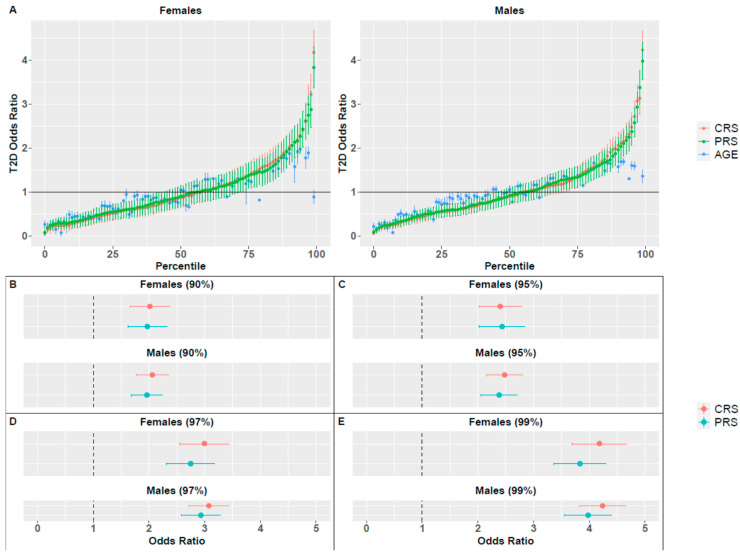
Figure 5.
Odds ratio (OR) for T2D, based on PRS, CRS or age percentiles. (A) OR for all percentiles and all measures for females and males. Vertical lines correspond to the standard deviation of the average OR across 1000 random splits of the dataset. The horizontal line represents a neutral OR of 1. OR values for females and males in specific percentiles are also presented: (B) 90th, (C) 95th, (D) 97th and (E) 99th.

