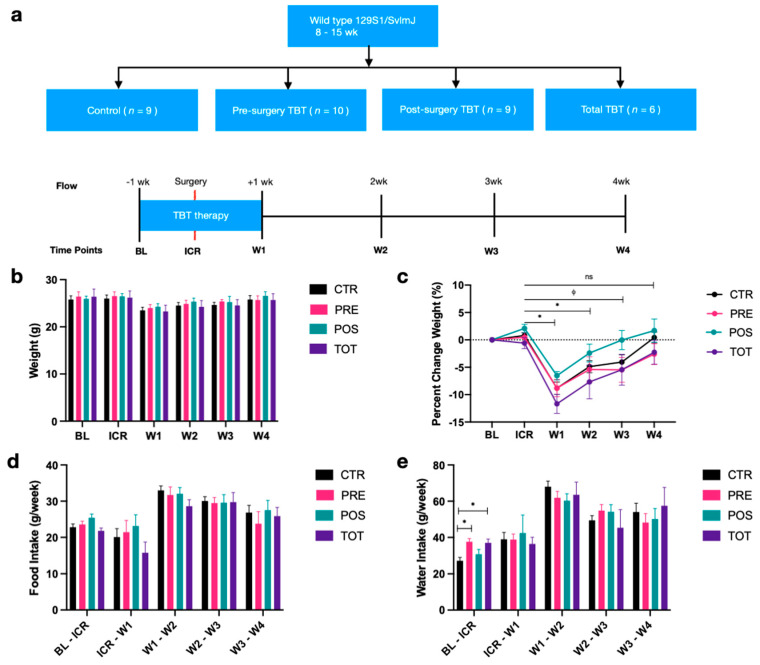
Figure 1.
Overview of study design and changes in weight, food, and water intake. (a) Study design overview. Column graphs represent median +/− SEM. (b) Mouse weights from baseline to week 4 across intervention groups. (c) Percent change in weight relative to baseline across intervention groups. (d) Differences in weekly food intake across intervention groups. (e) Differences in weekly water intake across intervention groups. All p-values were two-sided with statistical significance defined as p < 0.05. * represents significance in paired analysis for percent change relative to baseline for all groups; represents significance in paired analysis for percent change relative to baseline for control group alone. ns represents values that are not significant.

