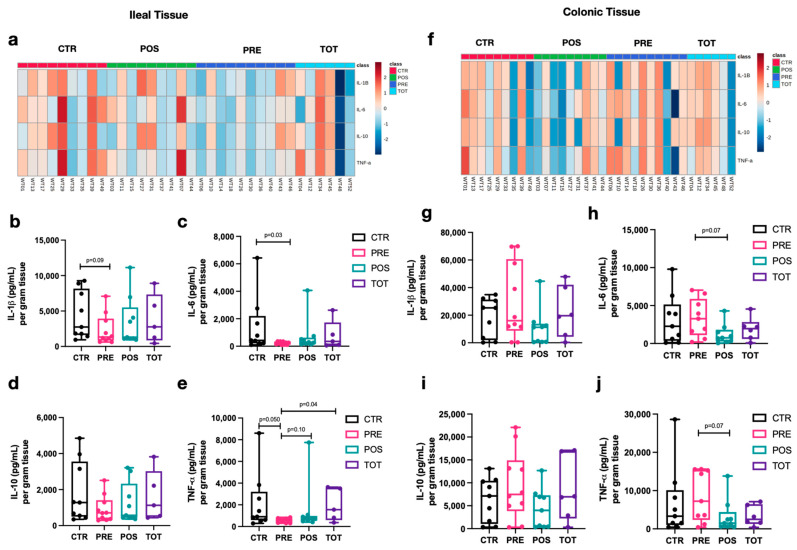
Figure 5.
Tissue-weight-adjusted cytokine concentrations in perianastomotic ileal and colonic tissue homogenate. Box-and-whisker plots represent the distribution of each group at W4. The median is represented by the middle line while the upper and lower borders of the box plot identify the 75th and 25th percentile, respectively. The whiskers correspond to the maximal and minimal values. (a) Heatmap of ileal tissue cytokine concentrations after logarithmic transformation of data. (b–e) Concentration of IL-1 β, IL-6, IL-10, and TNF-α, respectively, per gram of dry ileal tissue. (f) Heatmap of colonic tissue cytokine concentrations after logarithmic transformation of data. (g–j) Concentration of IL-1 β, IL-6, IL-10, and TNF-α, respectively, per gram of dry colonic tissue.

